Just imagine a scenario where your counterpart—the Minister of Economic Development in country X—is soon to present to his Congress the latest poverty trends. This is for a hearing on the country’s next 5-year (or 10-year) economic development plan. As a development practitioner, you are tasked with supporting him or her with the technical analysis, despite the notorious challenge that the most recent round of household survey data is not
comparable to earlier rounds due to various changes in survey design. Or even worse, the most recent survey round is already several years old and thus does not reflect the
latest trends. What should you do?
Even though being hypothetical, this example may be relevant to quite a few number of countries ranging across income levels and geographic settings. Take as an example, there used to be a lively discussion about the speed of poverty reduction in India in the 1990s caused by changes that result in inconsistent questionnaires across survey rounds (see, e.g., the book “The Great Indian Poverty Debate” edited by Angus Deaton and Valerie Kozel, (2005). The Government of India proclaimed that 60 million people were lifted out of poverty, but other independent researchers had different viewpoints and lower estimates as well. Some of their estimates even suggested that zero people escaping poverty! Another example is Jordan—the country of our recent study—in which the latest household consumption survey is currently available only for 2010, but where we want to know what has happened with poverty since then.
Absent actual consumption (or income) data, a natural strategy would be to use the existing data sources to generate some imputed data, which can then be employed to estimate the latest poverty numbers. The basic ideas (assumptions) are rather straightforward: if the available surveys can provide comparable data on certain other non-missing household characteristics (e.g., age, gender, ethnicity, education, occupation, assets), which can provide reliable estimates of household consumption in a statistical model, and whose changes can capture the changes in poverty, we can impute the missing consumption data.
The statistical devil is unsurprisingly in the details, however. A number of imputation techniques have been proposed not just in economics but in other disciplines including statistics, psychology, and health sciences. In particular, economic studies that build on a survey-to-census imputation technique commonly known as “ poverty mapping” have provided survey-to-survey imputation to estimate poverty trends in different settings (see our paper for a detailed literature review). Our paper is an attempt to elevate all these discussions into a systematic framework with explicit statistical assumptions and modelling options that are more generally applicable to different types of survey.
Here is a quick and non-technical summary of our proposed estimation procedures (another longer summary is here). First, check that the surveys being used for imputation are comparable. Second, using the data in survey 1 that have consumption, estimate the parameters of the household consumption model and the distributions of their error terms. Third, impose these predicted parameters and the simulated distributions of the error terms on the data in survey 2 (that do not have consumption) to predict (impute) household consumption. Finally, estimate the standard errors and provide other robustness checks as necessary.
To help automate this estimation procedure, we provide a Stata program named “ povimp” (short for poverty imputation), which is joint work with our World Bank colleague Minh Nguyen. The best way to install this program is by simply typing “ ssc install povimp” from within Stata, so that it can be downloaded directly by Stata from the SSC Archive. Our program also allows for using the complex survey design structure of your data with all the standard Stata’s clustering and stratification options. Note that in addition to the three estimation methods (i.e., normal linear regression, empirical distribution of the error terms, and probit) discussed in our paper, this program also provides an additional modelling option with the logit model.
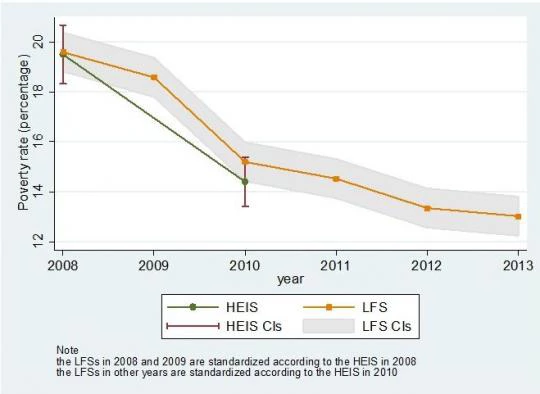
Coming back to our application to Jordan, Figure 1 below provides a graphical summary of the main estimation results. The green line represents the poverty rates estimated from the actual household consumption data, while the orange line our estimates using the labor force surveys. For 2008 and 2010, the two years when both types of survey are available, our estimates show a reasonable performance and fall within the 95 percent confidence interval of the true rates.
Figure 1 indicates a steadily decreasing trend for poverty rates over time, but this trend is less steep during the years 2010-2013 compared to the previous period 2008-2010. Perhaps this can be due to various events taking place in the economy during this time period such as subsidy reforms, a continued weak labor market, increased energy prices, and a large influx of war refugees from Syria.
Interestingly enough, history may repeat itself with poverty estimation! The questionnaire for the most recent round of the India National Sample Survey (NSS) in 2011/12 is generally considered to be not exactly identical with those in earlier rounds. Thus the dramatic reduction of poverty by 8 percentage points over a two-year interval (from a poverty rate of 29.9 percent in 2009/10) has unsurprisingly been causing certain debate in this country. But our preliminary imputation estimates are rather close to this figure, suggesting that the poverty decline between 2009/10-2011/12 may not be overstated. But perhaps we will come back to blogging about our ongoing paper on this interesting topic in a later post.
Given the increasing attention to poverty estimation in data-scarce environments, we hope that our paper can add more supporting evidence that survey-to-survey imputation methods can introduce a valuable tool for poverty tracking purposes. But we would love to learn more from your experience as our research and thinking on this topic is evolving. Please feel most welcome to share with us your favorite technique.
Even though being hypothetical, this example may be relevant to quite a few number of countries ranging across income levels and geographic settings. Take as an example, there used to be a lively discussion about the speed of poverty reduction in India in the 1990s caused by changes that result in inconsistent questionnaires across survey rounds (see, e.g., the book “The Great Indian Poverty Debate” edited by Angus Deaton and Valerie Kozel, (2005). The Government of India proclaimed that 60 million people were lifted out of poverty, but other independent researchers had different viewpoints and lower estimates as well. Some of their estimates even suggested that zero people escaping poverty! Another example is Jordan—the country of our recent study—in which the latest household consumption survey is currently available only for 2010, but where we want to know what has happened with poverty since then.
Absent actual consumption (or income) data, a natural strategy would be to use the existing data sources to generate some imputed data, which can then be employed to estimate the latest poverty numbers. The basic ideas (assumptions) are rather straightforward: if the available surveys can provide comparable data on certain other non-missing household characteristics (e.g., age, gender, ethnicity, education, occupation, assets), which can provide reliable estimates of household consumption in a statistical model, and whose changes can capture the changes in poverty, we can impute the missing consumption data.
The statistical devil is unsurprisingly in the details, however. A number of imputation techniques have been proposed not just in economics but in other disciplines including statistics, psychology, and health sciences. In particular, economic studies that build on a survey-to-census imputation technique commonly known as “ poverty mapping” have provided survey-to-survey imputation to estimate poverty trends in different settings (see our paper for a detailed literature review). Our paper is an attempt to elevate all these discussions into a systematic framework with explicit statistical assumptions and modelling options that are more generally applicable to different types of survey.
Here is a quick and non-technical summary of our proposed estimation procedures (another longer summary is here). First, check that the surveys being used for imputation are comparable. Second, using the data in survey 1 that have consumption, estimate the parameters of the household consumption model and the distributions of their error terms. Third, impose these predicted parameters and the simulated distributions of the error terms on the data in survey 2 (that do not have consumption) to predict (impute) household consumption. Finally, estimate the standard errors and provide other robustness checks as necessary.
To help automate this estimation procedure, we provide a Stata program named “ povimp” (short for poverty imputation), which is joint work with our World Bank colleague Minh Nguyen. The best way to install this program is by simply typing “ ssc install povimp” from within Stata, so that it can be downloaded directly by Stata from the SSC Archive. Our program also allows for using the complex survey design structure of your data with all the standard Stata’s clustering and stratification options. Note that in addition to the three estimation methods (i.e., normal linear regression, empirical distribution of the error terms, and probit) discussed in our paper, this program also provides an additional modelling option with the logit model.
Coming back to our application to Jordan, Figure 1 below provides a graphical summary of the main estimation results. The green line represents the poverty rates estimated from the actual household consumption data, while the orange line our estimates using the labor force surveys. For 2008 and 2010, the two years when both types of survey are available, our estimates show a reasonable performance and fall within the 95 percent confidence interval of the true rates.
Figure 1 indicates a steadily decreasing trend for poverty rates over time, but this trend is less steep during the years 2010-2013 compared to the previous period 2008-2010. Perhaps this can be due to various events taking place in the economy during this time period such as subsidy reforms, a continued weak labor market, increased energy prices, and a large influx of war refugees from Syria.
Interestingly enough, history may repeat itself with poverty estimation! The questionnaire for the most recent round of the India National Sample Survey (NSS) in 2011/12 is generally considered to be not exactly identical with those in earlier rounds. Thus the dramatic reduction of poverty by 8 percentage points over a two-year interval (from a poverty rate of 29.9 percent in 2009/10) has unsurprisingly been causing certain debate in this country. But our preliminary imputation estimates are rather close to this figure, suggesting that the poverty decline between 2009/10-2011/12 may not be overstated. But perhaps we will come back to blogging about our ongoing paper on this interesting topic in a later post.
Given the increasing attention to poverty estimation in data-scarce environments, we hope that our paper can add more supporting evidence that survey-to-survey imputation methods can introduce a valuable tool for poverty tracking purposes. But we would love to learn more from your experience as our research and thinking on this topic is evolving. Please feel most welcome to share with us your favorite technique.

Join the Conversation