
The Statistical Capacity Indicator’s Global Reach
Since 2004, the SCI continues to assess the capacity of a developing country’s ability to adhere to international statistical standards and methods, whether or not its activities are in line with internationally recommend periodicity, and whether the data are available in a timely fashion.
To this end, there are 25 indicators that annually monitor and “grade” a country’s statistical capacity progress and thus form the basis for the overall SCI score calculation.
While NSOs are the main users of the SCI score, the World Bank Group, international development agencies, and donor countries also refer to the SCI score for their own evaluation and monitoring purposes.
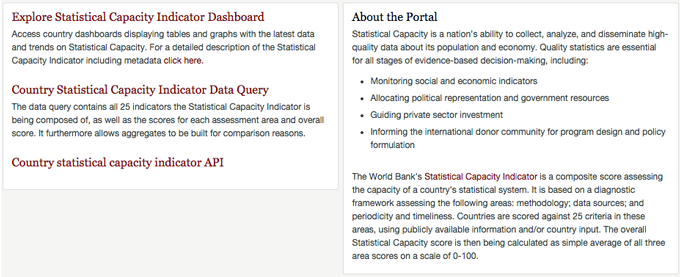
One online tool that continues to help NSOs strengthen their national statistical systems in a sustainable manner is the SCI website (worldbank.org/data/bbsc). The site was recently revamped to provide more resources in a more user-friendly manner and to allow for easier access to country scores as well as aggregates for both recent and historical data.
The World Bank’s Development Data Group worked on the redesigned website with support from the Information Technology Solutions Group.

Some new features of the website include:
- Country dashboards that show time series of the statistical capacity indicator (SCI) or “scores” for individual countries along with scores for the three different categories, i.e. methodology, source data, and periodicity
- Data queries and cross country comparisons made possible by DataBank
- Insertion of an application programming interface (API) that allows easy access to the data for other agencies
- A listing of Bank Group projects that feature statistical/data components. These projects are searchable by country or funding instrument
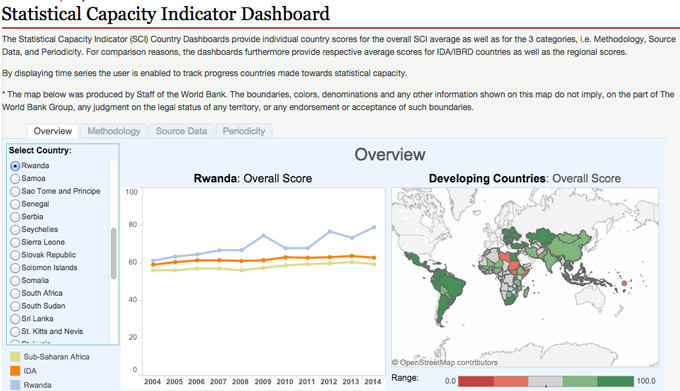
Overall Statistical Capacity Indicator score and three category score time series for developing countries, 2004-2014
The above chart shows the progress of the overall SCI score and the three category scores for all countries over time. When the SCI score was first calculated in 2004, the average SCI score was 64. Today, the average score is 68. What the chart also depicts are the areas the average country is most challenged with, compliance with international standards and methods, as well as data collection frequency.


Join the Conversation