Co-author: Seyed Reza Yousefi
What does the “fiscal austerity” debate now blaring across the news mean for our clients? A recent academic spat turned media controversy centers on the role of national debt in holding back economic growth. We decided to take a closer look; it turns out to be instructive.
First, a quick recap… In 2010, Carmen Reinhardt and Kenneth Rogoff (RR) put together some historical economic averages to claim that high debt levels tended to accompany lower growth. They grouped countries in given years into four categories according to the debt-to-GDP ratio (0-30, 30-60, 60-90, 90+), finding:
“…our main result is that whereas the link between growth and debt seems relatively weak at ‘normal’ debt levels, median growth rates for countries with public debt over roughly 90 percent of GDP are about one percent lower than otherwise; average (mean) growth rates are several percent lower.”
Then, last month, Thomas Herndon, Michael Ash, and Robert Pollin (HAP) of the University of Massachusetts, Amherst, reused RR’s files to show that the “90 percent effect” was due entirely to mistakes in data handling. Still, HAP found a persistent, linear, negative relationship between debt and growth. In their conclusion they contrast RR’s “nonlinear cliff” with:
“…the reality of modestly diminished average GDP growth rates for countries carrying high levels of public debt.”
Yet HAP’s correction of missteps in RR leaves untouched a basic issue that affects all research on the debt-growth link. Despite their acknowledgement of the issue, neither paper even attempts to tease out what we might call the “drag effect” of borrowing on growth from the confounding fact that debt-to-GDP ratios increase faster when growth slows.
This “reverse causality” is in part mechanical: when the denominator, GDP, rises more slowly, the ratio, debt/GDP, necessarily rises more quickly. This is even before accounting for effects via the numerator, through weakened revenues and greater demands on spending. Moreover, because GDP growth is persistent (recessions and booms tend to last several years), a low-growth year often comes at the end of a longer period of rising debt ratios, reinforcing the effect.
So the causal chain may run from growth to debt rather than the other way around. Indeed this “reverse causality” may be empirically at least as important as any “drag” effect, of borrowing on growth.
Comparing growth and debt within the same year lumps both these directions of causality together. Patterns in these numbers therefore give a false impression of stronger-than-reality growth consequences of fiscal decisions (“austere” or otherwise). Yet, eliding the obvious fact that the policy-relevant drag effect on growth is their real motivation, RR (and by extension HAP) present average growth by indebtedness in the same year.
The authors thereby leave readers with an unstated yet subtly demanding task: either make the superficially simple inference that their growth differences indicate true policy trade-offs; or make the conceptually harder, less satisfying inference that these within-period differences are in fact irrelevant for policy.
The second inference is, unfortunately, the correct one in this case.
We ran a quick check (anyone can do it; RR made their data public). The simplest way to control (at least partially) for causality going from growth to debt ratios, while allowing for time lags, is to look at average growth in the years following the year for which the initial debt ratio is measured. Viz.: associate France’s debt ratio at the end of 1979 with its average growth from 1980 to 1982 (rather than its growth in 1979); then compare this with France in other years and with other countries.
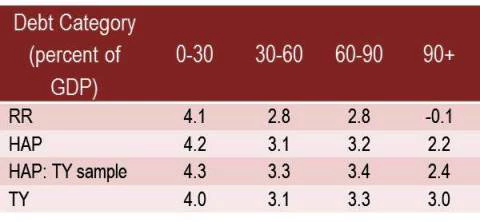
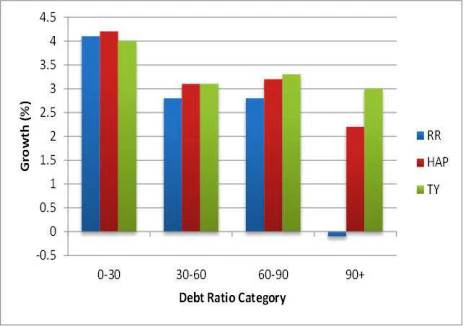
Following this approach, we took the same averages within groups of countries and years grouped by debt ratios, using the same data and classifications as RR and HAP, but taking average growth in the three years following the debt ratio measure (we used three years but it makes no difference if you use, say, five). The negative relationship between debt and growth disappears almost completely (see row 4 labeled “TY” in the table below and the green bars of the graph).
Table 1
Average Growth Rates
Source: Reinhardt and Rogoff dataset, authors’ analysis.
Graph 1
Growth by Debt Ratios in RR Data (green bars use subsequent growth)
There is still a modest reduction in growth around a 30 percent debt ratio (not very useful for current European and US debate). This drives a correlation between initial debt and subsequent growth that is significant for the whole sample (with an implied tradeoff of a little under 0.1 percent annual GDP growth for a 10 percentage point increase in the debt ratio). But this relationship is insignificant restricting to countries above 30 percent debt to GDP. Finally, we lose a few data points by taking averages across periods, so the third line of the table (HAP: TY sample) confirms that our results are not due to this small change in sample coverage.
Our narrow conclusion is that in the dataset constructed by RR, there is no evidence that growth is significantly affected “in a time of debt.” The limited effect present in these data is at low public debt levels. Given the difficulty of coming up with economic reasoning why such low debt levels would be a drag on growth, we would argue that this is a random outcome rather than indicative of the inhibiting role of debt.
What does all this mean for our clients? Does debt not really matter after all?
That is certainly not the point of this post. As our experience with debt relief has shown, at very high debt ratios, debt service can become an intolerable burden on low-income economies. And among emerging markets, defaults have laid bare the difficulties of maintaining high external debt in hard currency, with the exchange rate risk this runs. But beyond these facts, repeated careful attempts have found the debt-to-growth causal link hard to pin down.
Our broad conclusion from this modest robustness check is that simple within-period correlations between debt and growth do not form an adequate basis on which to build policy recommendations that have important consequences for borrowing, public spending, and development.

Join the Conversation