More than 50 countries have recently published explicit financial inclusion strategies and committed to formal targets for financial inclusion. These strategies and commitments reflect a growing recognition of the role of financial inclusion in reducing poverty and boosting shared prosperity. The Financial Inclusion Strategies Database—one of the supporting materials for the World Bank Group’s Global Financial Development Report 2014—summarizes the national strategies in a format that eases comparisons across countries, thus assisting research in this area. In this post, we present an introductory statistical analysis of the dataset.
Which countries adopt the strategies?
The Financial Inclusion Strategies Database comprises 56 countries that span all major geographic regions. The countries have made formal commitments under the Alliance for Financial Inclusion’s Maya Declaration or have been identified by the Financial Inclusion Strategy Peer Learning Group as having significant national strategies. Several other countries have national level documents on the subject (such as the strategy prepared in the United Kingdom by the country’s Financial Inclusion Taskforce). However, for the purpose of this dataset, we limit ourselves to countries that have made formal commitments at the international level through the above mentioned forums.
What do the countries with national inclusion strategies have in common? What differentiates the 56 countries from the rest of the world? To provide preliminary answers to these questions, we ran probit regressions estimating the probability of a country adopting a financial inclusion strategy as a function of macroeconomic, financial, and other indicators (table 1).
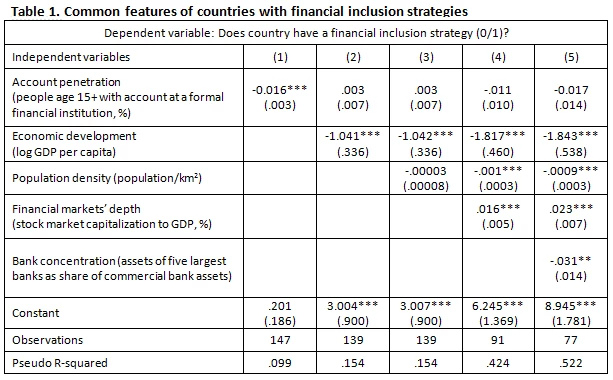
Note: Regressions performed using multivariate probit model. Numbers in parenthesis are standard errors. *, **, *** denote significance at 10, 5 and 1 percent, respectively. The cut-off point for the data is November 30, 2013.
As shown in table 1, the probability of a country having a strategy has a significant and robust negative relationship to the level of economic development, approximated by the log gross domestic product per capita. This makes sense, as poorer countries tend to have lower degree of financial inclusion, and are likely to benefit more from nation-wide efforts to improve financial access. For the same reasons, the probability of having a financial inclusion strategy is also negatively related to the existing level of financial inclusion. However, this relationship disappears when controlling for the level of economic development and other factors.
The probability of having a national strategy is negatively correlated with population density, even after controlling for the other factors in table 1. This also makes sense. Providing financial services in sparsely populated areas tends to be costly, so countries with low population density benefit more from special strategies to reach the unbanked in an efficient way.
The results in table 1 also suggest that national financial inclusion strategies are less likely in countries with relatively concentrated banking sectors and with relatively lower stock market capitalization. These results may reflect the greater monopoly power and greater risk of regulatory capture in financial systems that are dominated by a handful of large banks. Financial inclusion strategies—which tend to call for greater competition among financial services providers—are likely to face stronger push-back in such concentrated systems.
Other potential explanatory variables, including proxies for the stability of the macroeconomic environment, experience with banking crisis, financial institution depth, and inflation were not statistically significant. These preliminary results provide an interesting primer on the relationship between macroeconomic characteristics and national strategy adoption. They do not establish causal relationships, but they provide intriguing pointers for further research.
Common features of financial inclusion strategies
Looking at the contents of the national financial inclusion strategies, one finds many commonalities. The strategies’ overall aim tends to be empowering people by improving their access to financial services. The strategies generally involve a mix of numeric targets and policy areas of commitment such as improving consumer protection, financial literacy, expansion of mobile financial services and microfinance.
Specifically, we find that the strategies contain several common policy areas with explicit commitments. These are as follows (the numbers in parentheses are the percentages of strategies that contain an in-depth section on the respective subject):
- improving financial literacy (63 %);
- modifying the regulatory framework to enhance financial access (61 %);
- data collection and measurement (59 %);
- increasing consumer protection (50 %), and;
- expansion of mobile financial services (39 %).
There are also similarities in the institutional framework for financial inclusion. In 40 of the 56 countries (71 %), the strategy’s lead agency is the respective central bank. The strategies generally involve other institutions, such as a ministry of finance or financial supervision agencies (when separate from the central bank). The central bank is more likely to be a lead agency in jurisdictions where it is also an integrated financial sector supervisor.
Differences among financial inclusion strategies
The database highlights that--despite some commonalities—the strategies differ greatly in the breadth of coverage, the level of detail, and their specificity. While some of the differences among strategies reflect the specific country circumstances, there is scope for more alignment in the strategies and their communication. A useful resource on the subject is the Financial Inclusion Strategies Reference Framework.
Illustrating the differences is the fact that only about one-third of the strategies (19 out of 56) have specific numeric targets and timelines for the achievement of the targets. The others provide broad goals (such as “increasing financial inclusion”) without specific numeric targets and time-bound commitments.
Several elements of the national financial inclusion strategies are specific to a few countries, because of their country characteristics and existing barriers to financial inclusion. For example, India and Indonesia have focused on national level financial identity programs to improve effectiveness. Also, 13 countries have focused on reforming their payment system strategy, which involves efforts such as channeling social payments and remittances through financial accounts. Others have focused on increasing the provision of and access to microfinancial services, such as microinsurance, microsavings and microcredit. Fifteen countries seek to provide alternate financial products such as e-money platforms and special savings accounts to better suit the needs of their populations. Four countries focus on establishing credit informational systems to provide borrowers more information and encourage responsible lending.
Going forward
The Financial Inclusion Strategies Database underscores the scope for further improvements in the design of the national financial inclusion strategies. While it is too early to evaluate the impact of the national strategies, the database is a useful tool for comparing strategies across different countries, and it should make subsequent analyses easier.
To provide guidance in countries’ efforts to improve financial inclusion, the World Bank Group’s recently released Global Financial Development Report 2014. It is the most comprehensive study yet on the subject, highlighting new evidence on policies that improve—and those that undermine—access to finance. It can help countries in charting the road towards greater financial inclusion.


Join the Conversation