According to its first-ever Knowledge Report, published earlier this year, the World Bank spends over $600 million a year on “core knowledge services” – research, economic and sector work, technical assistance, “knowledge management”, training, and the like. Yet as the authors of report concede, precious little is known about the impact of this spending.
In a post on this blog last year, I reported on some work that Martin Ravallion and I did on a subset of the Bank’s knowledge portfolio – formal publications. We found the publications portfolio is larger than typically thought: the Bank’s Documents and Reports (D&R) database excludes the vast majority of journal articles authored by Bank staff, and there are as many of these as there are books and other formal publications published by the Bank. We also tried to look at the impact of the Bank’s publications on development thinking, which we measured using citations in Google Scholar. We found that, despite a view by some that the Bank is more a proselytizer than a producer of new knowledge, a lot of Bank publications do get cited a lot, suggesting that these publications contain new knowledge that’s considered useful by others.
This is all very interesting and reassuring, but I’d be the first to concede that citations aren’t the right measure of impact for the bulk of the Bank’s knowledge “products”, including the bulk of its publications. Most, after all, don’t claim to add new knowledge; rather they aim to repackage existing knowledge – tailoring it to a specific country’s needs, making it accessible to a broad audience, and so on.
Getting at development impact of any knowledge product is obviously a huge challenge. But it seems plausible that use is a key step in the causal chain running from the knowledge product production to development impact. It’s on this intermediate step that I focus on in this post, proxying use by downloads.
Small print and a caveat
I look at items that are downloadable from the Bank’s three Human Development (HD) Network websites – Education; Health, Nutrition and Population (HNP); and Social Protection (SP). I focus on downloads over the last four years – 11/1/2007 – 11/14/11 – and limit my attention to the 200 most-downloaded items for each website. Two of the three websites – the HNP and SP sites – spread their resources across several folders (my thanks to the HD staff who maintain the websites for their help identifying them); I aggregated the top 200 from each folder and eliminated duplicates to get the global top-200 for each of these two sectors. The top-200 is sufficient to give me two useful summary statistics: the number of downloads of the most downloaded item; and the h-index (an h-index of 100 means that the website contains as many as 100 items that have been downloaded at least 100 times).
Now for the caveat – each of the three websites very sensibly often just links to documents that are stored elsewhere on the internet, rather than duplicating them on their own websites. Often they simply point to the document in the D&R database, which contains not just formal Bank publications and the Bank’s flagship Policy Research Working Papers (PRWP) series, but also things like reports to the Board of Executive Directors, briefs, economic and sector work, and project documents such as implementation completion reports. Or the website may point to the website of one of the Bank’s regions or country offices. Sometimes, a website will link to an external site, such as issuu where many Bank books are now available. Whenever the item is linked to rather than uploaded to the website, I will miss it in the calculations that follow.
I offer two arguments in my defense
First, there’s still a huge volume of downloadable materials on these three websites. It’s true that the criteria for uploading versus linking aren’t crystal clear, but the fact remains there’s a lot of stuff that people can – and do – download from these sites.
Second, to set the HD website download figures in context, I compare them with download data for the PRWP series and the remaining hodgepodge of items in the D&R database. Unfortunately, it’s not possible at the moment to extract from these two piles documents that relate specifically to HD, since the method by which topics are assigned to D&R documents is … well, let’s say “work in progress”. A recent PRWP entitled “Task trade between similar countries” was assigned HNP as one of its topics despite the fact that the words "health", "nutrition" and "population" don't occur anywhere in the paper! I have a vision of an army of befuddled elderly people somewhere in India poring over Bank documents resorting in their befuddlement to the toss of a coin to assign topics. The good news – well, bad news actually for the elderly Indians – is that new software called Teragram is coming to the rescue, and should be online in a couple of months. In the meantime, I’m afraid we’ll have to settle for the universe of PRWP and other D&R documents as our comparator.
The numbers
Figure 1 plots “download curves” for the three HD sectors, the PRWP series and the remaining items in D&R. Items are ordered in descending order of downloads – high download curves indicate high use.
Look first at the right-hand tails of the curves. They’re quite encouraging: even the 200th most-downloaded SP resource has been downloaded 135 times. The figures for Education and 254 and HNP are 219. The ordering of the curves is interesting too. The curve for D&R documents that aren’t working papers in the PRWP series lies (everywhere) above the PRWP curve which in turn lies (everywhere) above the three HD download curves. The most-downloaded non-PRWP document in D&R is the 2007 World Development Report, which was downloaded just over 10,000 times over the four years. The most downloaded PRWP is the 2008 paper “The Developing World Is Poorer Than We Thought, But No Less Successful in the Fight against Poverty”, which has been downloaded 8,195 times.
Figure 1: Download curves for HD sectors and PRWP series
Among the three HD sectors, it’s Education that has the highest download curve, starting at 7,490 downloads with the 2008 Bank book “Girls’ Education in the 21st Century”. To put this in context, only two working papers in the PRWP series and three other documents in D&R have been downloaded more often during the last four years. The recent education sector strategy document “Learning for All” comes second (3,096 downloads). Then third, fourth and sixth come a dataset – interestingly not one developed by the Bank, but rather by Robert Barro and Lee Jong-Wha for their 1993 NBER working paper “International Comparisons of Educational Attainment”. At number 13 is another Harvard product, this time a paper by David Bloom, David Canning, and Kevin Chan. To be fair to my Education friends, their top 200 includes plenty of homegrown goodies too. At number 8, for example, is the recently released “The Challenge of Establishing World-Class Universities” which has already been downloaded 2,166 times.
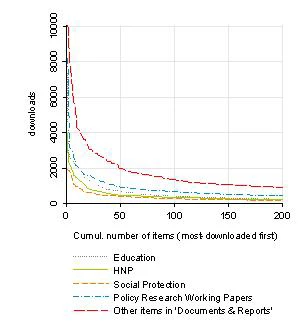
Next comes the HNP download curve, which starts at 3,692 downloads with my 2007 Bank book “Analyzing Health Equity Using Household Survey Data”. Only two working papers and 15 other documents in D&R have been downloaded more often. Second comes a dataset (2,413 downloads – this one developed by the Bank, showing HNP inequalities across wealth quintiles. Several of the remaining top 10 slots go to variants of – and supporting documents to – the new HNP strategy “Healthy Development” (2,195 downloads). “Health Financing Revisited” (1,587 downloads) also makes it into HNP’s top 10.
The SP curve starts at 1,943 downloads with the recent sector strategy concept note. Second comes one of the pension reform “primers” “The Financial Crisis and Mandatory Pension Systems in Developing Countries” (1,869 downloads). Third place goes to a non-Bank Powerpoint presentation on Brazil’s Bolsa Família program by Rômulo Paes de Sousa from the country’s Ministry of Social Development (1,865 downloads).
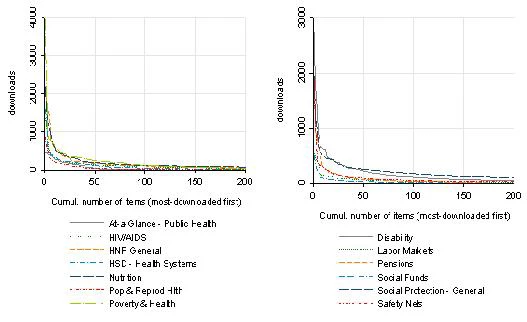
Historically, the Bank’s HNP and SP sectors have been organized around the thematic areas listed in Figure 2. Many resources don’t fall neatly into these areas; these are stored in a general folder. The download curves don’t fall in such a neat pattern as in Figure 1. For example, in the case of HNP, the “Poverty and Health” theme starts off highest, then dips below the General category, pops back up again, then dips below the Nutrition theme. Some unequivocal conclusions are possible, though: some curves lie everywhere below others.
Figure 2: Download curves for HNP and SP thematic areas
Click here to see a larger image.
The statistics in Table 1 help sort out the cases where the curves cross. Judging from downloads, some HD themes seem to be getting more traction than others. But all have had considerable success in producing (or – in some cases – disseminating) documents and other resources that are getting used. True – use doesn’t necessarily lead to development impact; but it’s hard to see how impact can occur without it.
Table 1: Bibliometric summary measures for the HNP and SP download data
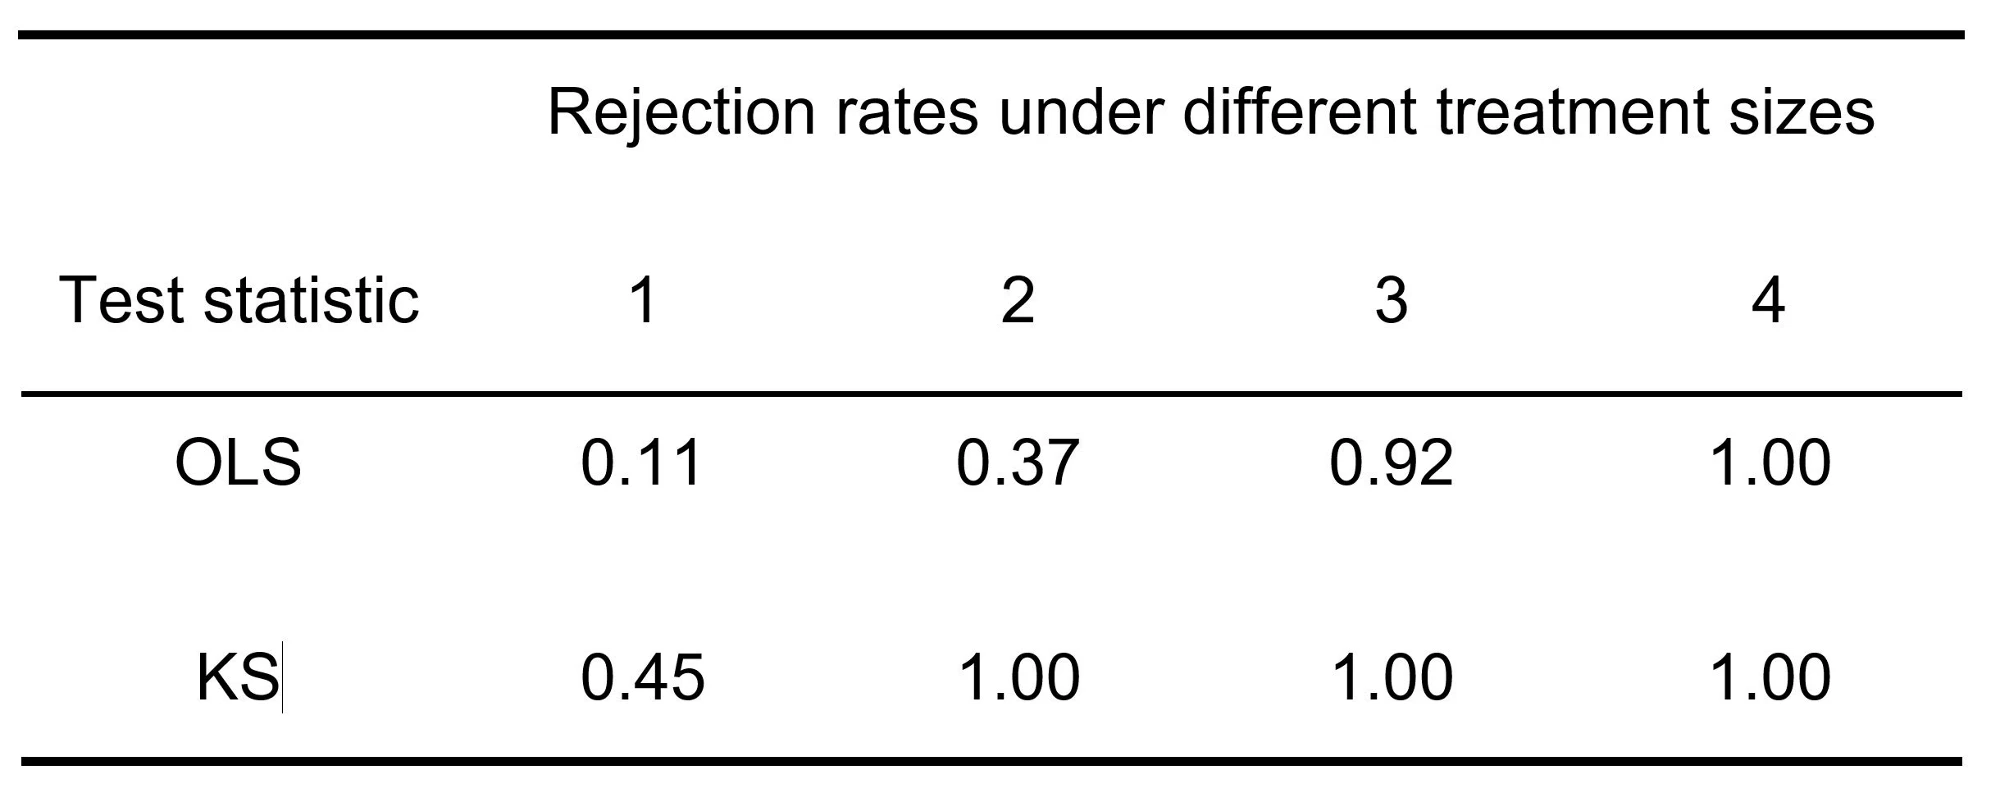
Note: The median and mean figures refer to the 200 most-downloaded items only. The maximum and h-index refer to the entire distribution.

Join the Conversation