Growth in the EAP region strengthened marginally to 6.4 percent in 2017, 0.2 percentage point higher than expected. The region continued to be a major driver of global growth, accounting for more than a third of it in 2017, mostly because of China’s significant contribution. Regional growth is projected to gradually slow to 6.2 percent on average in 2018-20. That is broadly in line with previous forecasts, with the structural slowdown in China outweighing a modest further cyclical pickup in the rest of the region. The outlook assumes a modest continuing recovery in commodity prices, strong external demand, and moderately tighter, but still supportive, global financing conditions.
Strong regional growth in 2017
Growth in the East Asia and Pacific (EAP) region strengthened marginally to 6.4 percent in 2017, 0.2 percentage point higher than expected. Growth in China inched up in 2017—a deviation from the economy’s structural slowdown. Growth in the region excluding China accelerated slightly in 2017 to around its potential rate, reflecting a cyclical recovery in large commodity exporters, such as Indonesia and Malaysia, and Thailand.
GDP growth
Source: World Bank.
Notes: Commodity exporters include Indonesia, Lao PDR, Malaysia, and Mongolia. Commodity importers ex. China include Cambodia, Philippines, Solomon Islands, Thailand, Vanuatu, and Vietnam. GDP-weighted averages.
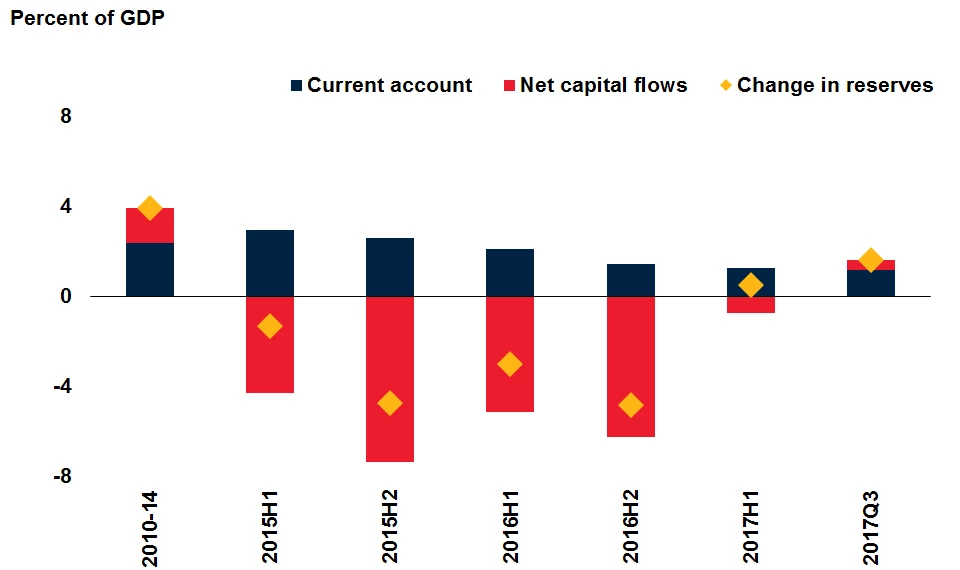
An improved external environment
The acceleration of regional growth last year largely reflected a significant improvement in the external environment—an expansion of global activity and trade, a recovery of commodity prices, and benign financing conditions. Trade flows recovered markedly across the region and net capital outflows from the region have reversed.
Balance of payments
Source: World Bank.
Note: Data for 2017 reflect 2017Q3.
Projected Gradual Slowdown in China Outweighs Pickup in Rest of Region
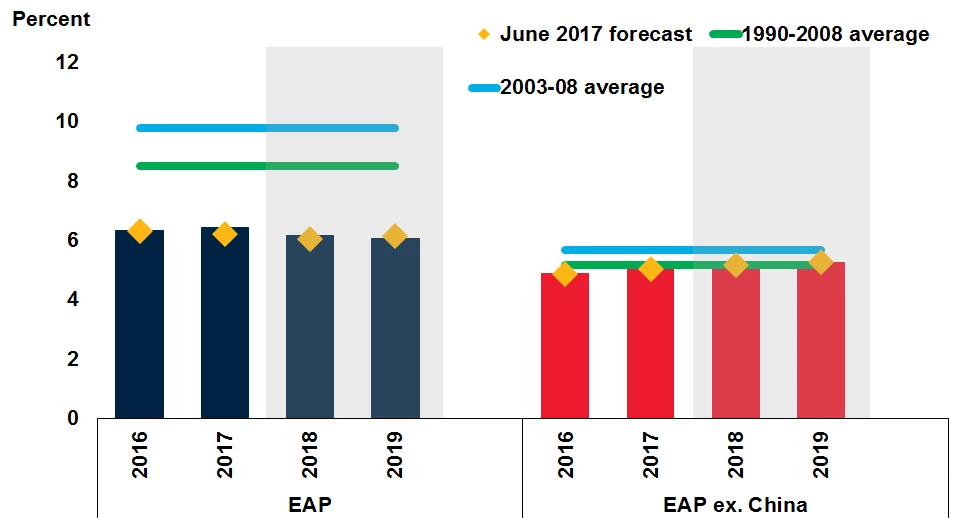
Regional growth is projected to gradually slow to 6.2 percent in 2018, and to 6.1 percent on average in 2019-20, broadly in line with previous forecasts. The structural slowdown in China is expected to outweigh a modest further cyclical pickup in the rest of the region. The region is expected to continue to be a major driver of global growth and account for more than a third of it in 2017-20, mostly because of China’s significant (30 percent) contribution.
GDP growth forecasts
Source: World Bank.
Notes:Yellow diamonds correspond with the June 2017 edition of Global Economic Prospects. Shaded areas indicate forecasts.
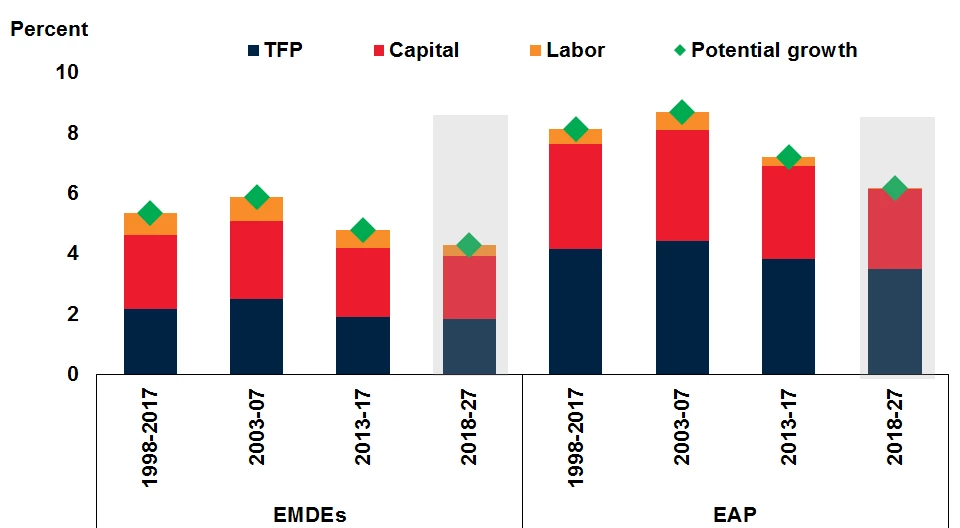
Potential Growth on Track to Decelerate
Beyond the forecast horizon, regional potential growth is anticipated to decelerate to under 6 percent in 2018-27, as demographic pressures in China and other large economies (for example Thailand) dampen labor supply and slow productivity growth, and as capital accumulation slows. Growth rates in China and in the rest of the region are expected to gradually converge.
Potential growth
Source: World Bank.
Note: Potential growth estimates based on production function approach.
Risks to the Outlook Are More Balanced
Risks to the forecast have become more balanced, especially because of the potential for further upside surprises to growth in advanced economies, but are still tilted to the downside. Downside risks include rising geopolitical tensions, an abrupt tightening of global financing conditions, increased global protectionism, and steeper-than-expected slowdowns in major economies, including China. Highly leveraged economies and countries with high or rapidly raising fiscal deficits are particularly vulnerable.
Total debt
Sources: Bank of International Settlements, Haver Analytics, International Monetary Fund, Quarterly External Debt Statistics.
Notes: Peak refers to the highest debt-to-GDP ratio reached since 1995Q1. The peak is identified to have occurred in 1997Q4 in Thailand, 1998Q4 in Malaysia, 2001Q4 in Indonesia, and 2017Q2 in China. 2017 data reflect 2017Q2. Total debt comprises of credit to household and non-financial corporations and general government debt (broad definition). For China, the sum of credit to household and non-financial corporations is consistent with the People’s Bank of China Aggregate Financing to the Real Economy (stock) level. General government debt includes central and local government debt and social security funds, but excludes public enterprises. Data presented in the chart is broadly consistent with the IMF estimates of total debt (World Bank 2017a).
Reforms Could Boost Growth
Policies to boost total factor productivity – defined as the portion of gains in output that can’t be explained by increases in the quantity of labor or capital -- across the region could partly offset the diminishing returns from capital and the effects of demographic trends in several major economies that dampen labor supply and slow productivity growth.
Potential output growth under reform scenarios
Sources: World Bank staff estimates; International Monetary Fund, World Economic Outlook.
Note: Policy scenarios are described in Annex 3.1 of the January 2018 GEP.
Strong regional growth in 2017
Growth in the East Asia and Pacific (EAP) region strengthened marginally to 6.4 percent in 2017, 0.2 percentage point higher than expected. Growth in China inched up in 2017—a deviation from the economy’s structural slowdown. Growth in the region excluding China accelerated slightly in 2017 to around its potential rate, reflecting a cyclical recovery in large commodity exporters, such as Indonesia and Malaysia, and Thailand.
GDP growth
Source: World Bank.
Notes: Commodity exporters include Indonesia, Lao PDR, Malaysia, and Mongolia. Commodity importers ex. China include Cambodia, Philippines, Solomon Islands, Thailand, Vanuatu, and Vietnam. GDP-weighted averages.
An improved external environment
The acceleration of regional growth last year largely reflected a significant improvement in the external environment—an expansion of global activity and trade, a recovery of commodity prices, and benign financing conditions. Trade flows recovered markedly across the region and net capital outflows from the region have reversed.
Balance of payments
Source: World Bank.
Note: Data for 2017 reflect 2017Q3.
Projected Gradual Slowdown in China Outweighs Pickup in Rest of Region
Regional growth is projected to gradually slow to 6.2 percent in 2018, and to 6.1 percent on average in 2019-20, broadly in line with previous forecasts. The structural slowdown in China is expected to outweigh a modest further cyclical pickup in the rest of the region. The region is expected to continue to be a major driver of global growth and account for more than a third of it in 2017-20, mostly because of China’s significant (30 percent) contribution.
GDP growth forecasts
Source: World Bank.
Notes:Yellow diamonds correspond with the June 2017 edition of Global Economic Prospects. Shaded areas indicate forecasts.
Potential Growth on Track to Decelerate
Beyond the forecast horizon, regional potential growth is anticipated to decelerate to under 6 percent in 2018-27, as demographic pressures in China and other large economies (for example Thailand) dampen labor supply and slow productivity growth, and as capital accumulation slows. Growth rates in China and in the rest of the region are expected to gradually converge.
Potential growth
Source: World Bank.
Note: Potential growth estimates based on production function approach.
Risks to the Outlook Are More Balanced
Risks to the forecast have become more balanced, especially because of the potential for further upside surprises to growth in advanced economies, but are still tilted to the downside. Downside risks include rising geopolitical tensions, an abrupt tightening of global financing conditions, increased global protectionism, and steeper-than-expected slowdowns in major economies, including China. Highly leveraged economies and countries with high or rapidly raising fiscal deficits are particularly vulnerable.
Total debt
Sources: Bank of International Settlements, Haver Analytics, International Monetary Fund, Quarterly External Debt Statistics.
Notes: Peak refers to the highest debt-to-GDP ratio reached since 1995Q1. The peak is identified to have occurred in 1997Q4 in Thailand, 1998Q4 in Malaysia, 2001Q4 in Indonesia, and 2017Q2 in China. 2017 data reflect 2017Q2. Total debt comprises of credit to household and non-financial corporations and general government debt (broad definition). For China, the sum of credit to household and non-financial corporations is consistent with the People’s Bank of China Aggregate Financing to the Real Economy (stock) level. General government debt includes central and local government debt and social security funds, but excludes public enterprises. Data presented in the chart is broadly consistent with the IMF estimates of total debt (World Bank 2017a).
Reforms Could Boost Growth
Policies to boost total factor productivity – defined as the portion of gains in output that can’t be explained by increases in the quantity of labor or capital -- across the region could partly offset the diminishing returns from capital and the effects of demographic trends in several major economies that dampen labor supply and slow productivity growth.
Potential output growth under reform scenarios
Sources: World Bank staff estimates; International Monetary Fund, World Economic Outlook.
Note: Policy scenarios are described in Annex 3.1 of the January 2018 GEP.

Join the Conversation