In a recent post in Let’s Talk Development, my colleague Adam Wagstaff raised a number of interesting points about measuring inequality of opportunity in the context of human development indicators, such as access to health services or educational achievement variables. His three main arguments, as I read them, were:
- The Human Opportunity Index (HOI), first proposed in this LAC regional study, inevitably understates the true extent of unfair inequality in access to services among children. This is because the dissimilarity index – the measure of inequality of opportunity within the HOI – captures only some of the inequality in (say) access to water among children while, in Adam’s view, all of that inequality is unfair.
- The Index of Economic Opportunity (IEO), used in the second part of that regional study, is also likely to understate the share of inequality in, say, student achievement among 15 year-olds, for a similar reason: students are partitioned into groups with identical circumstances (family background, gender, place of birth, race or ethnicity, etc.), and inequality of opportunity is measured as the share of the overall variance in test scores that occurs between – rather than within - those groups. Adam feels this is too little, because some of the within-group inequality may also be caused by factors beyond the young person’s responsibility – such as feeling sick on the day of the test, for example.
- Finally (though not in this order), Adam questions whether the HOI really is of much use to policymakers, because “it makes it hard to dig down and see what’s going on”. He suggests, as an alternative, the between-component of the Gini coefficient or, I think more precisely, of a concentration index.
Adam is a clever guy, so none of the above is just silly. But it gives me an excuse to make two comments of my own on the general issue of measuring inequality of opportunity. Some of my points are actually quite consistent with Adam’s; others less so. But I phrase them, nevertheless, as replies to each of his first two bullets above. The third issue - whether, or how, the measurement of inequality of opportunity is useful for policymakers - deserves a post of its own…
I. The HOI - much like the UNDP’s Human Development Index, which was inspired in part by Amartya Sen - has its pros and cons. Like the HDI, the HOI is a great communication tool that illustrates a fundamental point about development, and gets the public – and therefore policymakers – to think more about it. In the case of the HDI, the “point” was that development should not be measured by output or incomes alone. Other things, like education, health and longevity matter too, in their own right. And they are not perfectly correlated with incomes, so we should try to measure development outcomes more broadly. The HOI, which is much “younger”, tries to make the point that expanding access to basic services and opportunities for children is key to development, and that it matters that this is done fairly – without discriminating against children of a particular gender, ethnicity, region, or family background. As a tool for getting countries to worry about fairness in access to basic opportunities across all these different population subgroups, the HOI is potentially very useful. (As it happens, the similarities between the two indices do not stop there. Even though the HOI and the HDI are built on entirely different variables, the two indices are remarkably closely correlated. In the sample of 39 countries for which the two are available, the correlation is 0.94, as we show here.)
But of course, just like its older cousin, the HOI is an imperfect construct. The synthetic index aggregates across different services or “basic opportunities” (like water, sanitation, school attendance, etc) using completely arbitrary weights, and it is thus subject to Martin Ravallion’s “mashup index” critique. There are also two deeper problems: First, there is the obvious fact that the HOI is not a measure of inequality of opportunity per se. It is a measure of children’s access to services, penalized by inequality of opportunity. (The basic formula is the product of an average access rate by one minus the dissimilarity index.) And empirically, variation in the HOI is driven much more powerfully by the average term than by the inequality term, as we show in my recent paper with Brunori and Peragine, hyperlinked above.
Second, there is Adam’s first point, which relates to the age-old question of “age of responsibility”. Inequality of opportunity is often defined by contrasting the consequences of pre-determined circumstances with those of actions for which people should take personal responsibility. But we also often think of young children as not being accountable for most of their actions: That is certainly the view taken by many legal systems. In that case, below a certain age, any inequality in outcomes among children should be treated as inequality of opportunity, or unfair inequality. That this point had been made many times before does not detract from its value, and it is incumbent upon users and promoters of the HOI to be explicit about this interpretational limitation. (For full disclosure, I am a co-author of the volume that first proposed the HOI, so also to blame…)
II. Adam’s second point appears, at first glance, similar in nature: the index of economic opportunity (IEO) used in the second part of that LAC report is also likely to underestimate inequality of opportunity - he says - by leaving out other sources of unfair differences. But there is a big difference: the IEO is intended for use on populations above the (normative) age of responsibility, i.e. among individuals whose income or education levels are, in principle, the joint outcome of pre-determined circumstances and of their own efforts and responsibility. So the underestimation here does not occur by definition, but because of inevitable data limitations: we can never observe all of the morally irrelevant pre-determined circumstances that we should include in our decomposition (such as whether the child was unwell in the day of the test, in the above example). This is why we have always insisted that the IEO is only a lower-bound estimate of inequality of opportunity, as we proved here.
Of course, a lower-bound measure is not as good as a credible point estimate with a narrow confidence interval would be. It would certainly be better to have an index that estimated inequality of opportunity precisely. But because data is imperfect, and one can never observe all of the circumstances that matter, I am not aware of any such index, except where strong stochastic independence assumptions are made, either implicitly or explicitly.
But is the lower-bound estimate useless? Is it irrelevantly small, for example? Does it vary across countries in a meaningful way, or is the signal to noise ratio hopelessly low? We tend to draw some solace from two facts. First, there is substantial cross-country variation in the lower-bound estimates – larger when the outcome variable is income or consumption, but also marked for educational achievement. The share of the variance in PISA test scores accounted for by circumstance variables (i.e., the lower-bound IEO) ranges from 10% in Macao, to 35% in Germany(!) (Click here for the source, forthcoming in the World Bank Economic Review).
Second, correlations between the IEO and other variables for which we have strong theoretical priors on the sign (like income inequality or intergenerational mobility) have the expected sign and are typically strongly significant. The figure below shows the correlation between the IEO (also known as IOR…) for incomes and independent measures of correlation of years of schooling between parents and children. The indices come from different studies, and typically use unrelated data sets.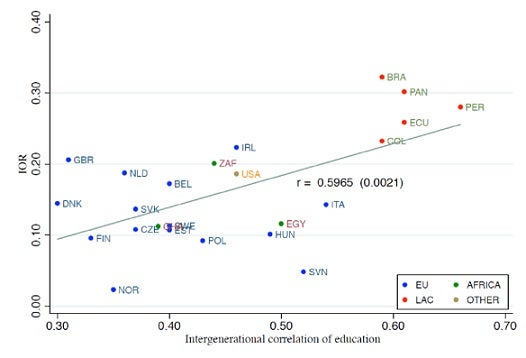
I have a lot of sympathy with Adam’s ultimate concern – that we don’t end up encouraging governments to claim that they have achieved low inequality of opportunity, when in fact they haven’t. This is not implausible: Chile has an HOI score of 92, when 100 is the maximum value the HOI can take. I don’t think anyone seriously believes that Chile is anywhere near some maximum level of equality of opportunity. The point, as noted earlier, is that the HOI is not a measure of inequality of opportunity. Now, is it believable that “almost all” Chilean children have access to clean water, electricity, sanitation and schools? Well, yes, that is believable. And that’s what the HOI sets out to measure.
The IEO, on the other hand, is a measure of inequality of opportunity. It is very simple to compute, since it really is just a specific application of a Theil (or variance) decomposition. But it links very nicely to the theoretical literature on “ex-ante” inequality of opportunity. (That is: it satisfies various nice and pertinent axioms…) It varies substantially across countries, from 2% in Norway (for incomes) to 51% in Guatemala (for consumption), and its significant correlations with per capita incomes, income inequality, and income mobility suggest that, event as lower bounds, they carry some signal. There is real information in these numbers about how (un)fairly countries divvy up opportunities for advancement among their people. If properly understood, this information can be as useful as other common scalar measures we often come accross, like the headcount index, the poverty gap, or the Gini coefficient. None of them is perfect (even as an index) and none of them tells policymakers what to do. At least I hope not! But they contain useful information, which may lead practitioners to ask further questions about which (and how) policies might work to reduce, say, poverty or inequality.

Join the Conversation