Estimating national-level growth levels and rates is fraught with challenges. Doing so at subnational levels even more so – because of data challenges, and difficulties in attributing economic activity to a specific subnational unit. However, as countries decentralize, estimating subnational economic activity and growth is becoming all the more relevant for at least three reasons: First, there is strong policy interest in seeing how growth can occur in different parts of countries, so that communities can share in national prosperity and not get left behind. Second, sub-nationals themselves want to understand how they stack up against their neighbors and competitors, and how much they contribute to national GDP. Third, such information could help private investors to better assess where to undertake investments.
Perhaps it is for these reasons why our new paper is attracting some media attention, including in the front pages of the Financial Times (“ Bright lights, growing cities and African statistics”), Kenya’s Business Daily ( “Nairobi ranked 8th on World Bank list of rich, poor counties”) and others such as “Lights, GDP, and Kiambu’s economic mysteries” or “ The Power of maps and how Africa can outgrow aid”.
The “why” is clear. But how to go about it?
In our paper , we use the night lights (satellite imagery from outer space) approach to estimate subnational 2013 GDP growth and levels for 47 counties in Kenya and 30 districts in Rwanda (following the Henderson et al paper in the AER). The use of night lights as a proxy for economic activity rests on the assumption that as almost all consumption and investment activities in the evening or night require lighting, the intensity of night lights (or its growth over time) can be used as a proxy for the intensity of economic activity (or economic growth). The range of applications has grown substantially in recent years, ranging from estimating economic growth at non-conventional levels over studying the evolution of inequality to testing the reliability of official statistics across different types of political regimes (among many others). Using night lights also has the advantage of seeing a new (and more accurate) estimation of informal activity, and being independent of official data. This makes night lights especially relevant for Africa, where most countries rank low on the World Bank’s Statistical Capacity Indicators, and some countries lack national accounts altogether. It is also much cheaper than cumbersome and conventional ways of estimating subnational GDP.
So what do our results show for Africa, in particular, Kenya and Rwanda?
As evident from Figure 1, Africa is the world’s most dimly lit place, and a significant share of its GDP comes from largely unlit agriculture. So are nightlights really a good proxy for economic performance in Africa? And if yes, can they be used to study subnational levels of economic activity and growth?
Figure 1: Intensity of night lights as seen from space
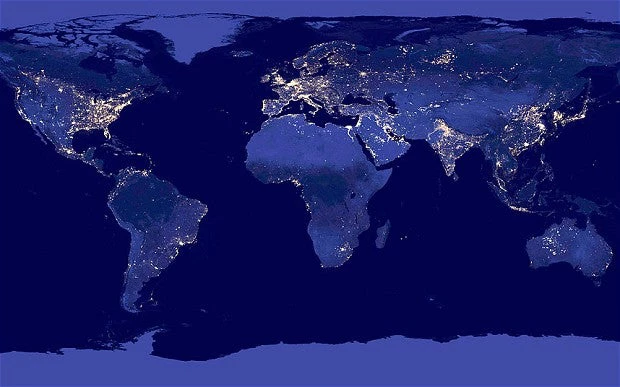
Source: NASA (http://pics-about.space/nasa-map-night-lights?p=2)
That’s what we try to address here. The first finding is that night lights do a pretty good job in tracking official GDP numbers, even in dimly lit Africa. Whether it is a massive contraction of economic activity as in the early 2000s in Zimbabwe or a slight temporary downturn in the late 1990s in Eritrea during the border conflict, the evolution of night lights as observed from space closely follows official GDP.
Lights closely track Zimbabwe’s fall...
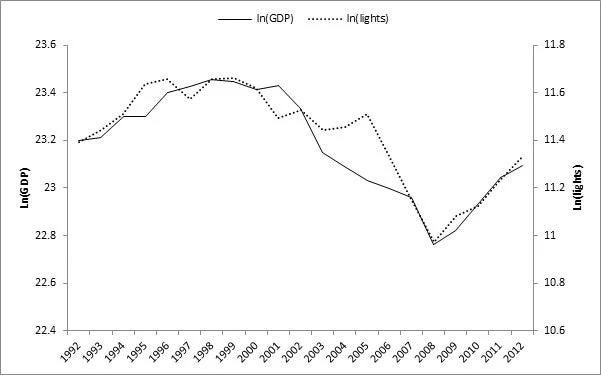
Source: WDI (2014) and NGDC (2014). Authors’ calculations
…and respond to Eritrea’s modest downturn during the border conflict
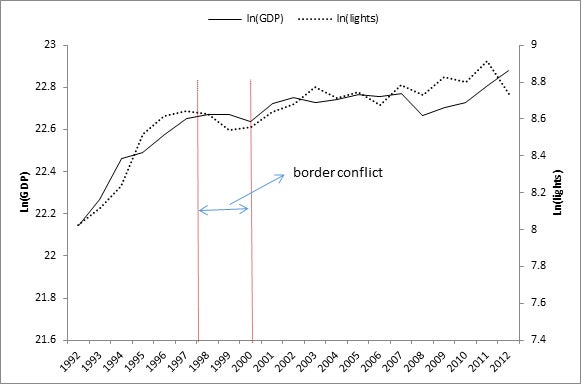
Source: WDI (2014) and NGDC (2014). Authors’ calculations. Vertical lines demarcate the border conflict period.
Second, night lights tend to underestimate official GDP growth in countries where agriculture is more important. Arguably, night lights pick up secondary and tertiary activities though not unlit agriculture. This seems to be confirmed by the data: the association between lights and GDP is substantially stronger in countries where agriculture is less important. This calls for the inclusion of other remote sensing data into the model, such as rainfall or vegetation indices.
Third, the first-cut subnational GDP estimates for Rwanda and Kenya have some surprises. For Rwanda, the three Districts of Kigali City account for 40% of national GDP, underscoring the lower scale of economic activity in the rest of the country. For Kenya too, there are a number of surprises. While Nairobi indeed has the highest estimated GDP of all counties, it only represents 13 percent of national GDP, a far cry from the 60 percent routinely aired in Kenya. Mombasa, widely deemed the second center of economic gravity, comes out as ninth (out of 47 counties) when estimating county GDP based on nightlights. However, we emphasize that the estimates are exactly that: estimates. The results are open for discussion and debate.
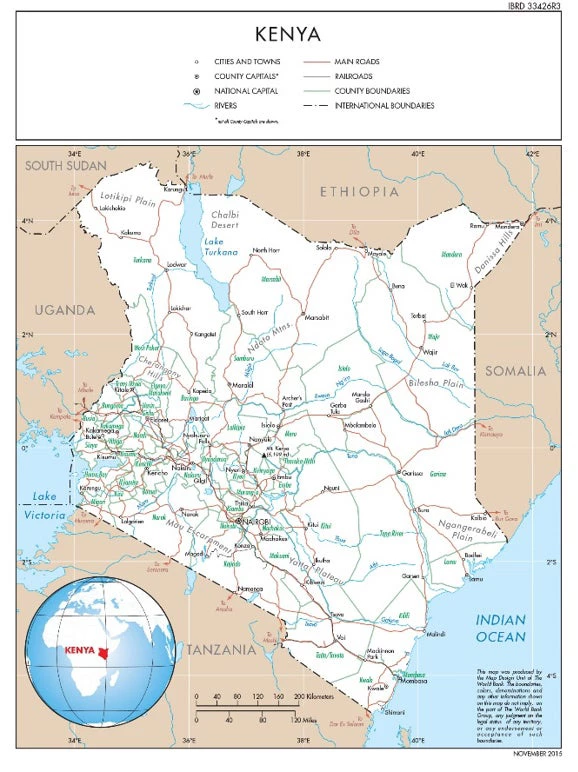
Comparing the actual County-map of Kenya (Figure 3) with the distorted map where county size is adjusted for estimated GDP (Figure 4) shows that Nairobi and the surrounding or not-too-far-off counties (Kiambu, Nakuru, Machakos, Kajiado, Nyeri) form the economic heartland of Kenya. While these Counties are relatively small, accounting for 23 percent of national population, they contribute an estimated 44 percent to GDP. On the other side, the Counties in purple in Figure 4 are large in size), but are among the poorest in Kenya.
Source: Authors’ calculations
So, what are the takeaways?
First, estimating subnational GDP is becoming increasingly policy relevant, especially in decentralized environments such as Kenya, where there is an ongoing debate on how many resources should be shared between the national government and subnationals. One possible criterion may well be subnational GDP.
Second, night lights data can be used to get fairly reliable estimates of economic activity, as we find out in our case, even in poorly-lit Africa. But there is ample scope for improvement. Capturing differences in agricultural performance through rainfall or vegetation data would likely improve the estimates, as would correcting for so-called overglow: brightness spreads out and spills over into neighboring counties, potentially allocating one county’s economic activity to another.
Third, given the way technology is advancing – who knows – perhaps someday we will be able to estimate not global, national or even subnational GDP…but individual-level GDP. If you think that’s, well, spaced out, think of the fact that we are now able to compute our individual contribution to global warming!
Perhaps it is for these reasons why our new paper is attracting some media attention, including in the front pages of the Financial Times (“ Bright lights, growing cities and African statistics”), Kenya’s Business Daily ( “Nairobi ranked 8th on World Bank list of rich, poor counties”) and others such as “Lights, GDP, and Kiambu’s economic mysteries” or “ The Power of maps and how Africa can outgrow aid”.
The “why” is clear. But how to go about it?
In our paper , we use the night lights (satellite imagery from outer space) approach to estimate subnational 2013 GDP growth and levels for 47 counties in Kenya and 30 districts in Rwanda (following the Henderson et al paper in the AER). The use of night lights as a proxy for economic activity rests on the assumption that as almost all consumption and investment activities in the evening or night require lighting, the intensity of night lights (or its growth over time) can be used as a proxy for the intensity of economic activity (or economic growth). The range of applications has grown substantially in recent years, ranging from estimating economic growth at non-conventional levels over studying the evolution of inequality to testing the reliability of official statistics across different types of political regimes (among many others). Using night lights also has the advantage of seeing a new (and more accurate) estimation of informal activity, and being independent of official data. This makes night lights especially relevant for Africa, where most countries rank low on the World Bank’s Statistical Capacity Indicators, and some countries lack national accounts altogether. It is also much cheaper than cumbersome and conventional ways of estimating subnational GDP.
So what do our results show for Africa, in particular, Kenya and Rwanda?
As evident from Figure 1, Africa is the world’s most dimly lit place, and a significant share of its GDP comes from largely unlit agriculture. So are nightlights really a good proxy for economic performance in Africa? And if yes, can they be used to study subnational levels of economic activity and growth?
Figure 1: Intensity of night lights as seen from space
Source: NASA (http://pics-about.space/nasa-map-night-lights?p=2)
That’s what we try to address here. The first finding is that night lights do a pretty good job in tracking official GDP numbers, even in dimly lit Africa. Whether it is a massive contraction of economic activity as in the early 2000s in Zimbabwe or a slight temporary downturn in the late 1990s in Eritrea during the border conflict, the evolution of night lights as observed from space closely follows official GDP.
Lights closely track Zimbabwe’s fall...
Source: WDI (2014) and NGDC (2014). Authors’ calculations
…and respond to Eritrea’s modest downturn during the border conflict
Source: WDI (2014) and NGDC (2014). Authors’ calculations. Vertical lines demarcate the border conflict period.
Second, night lights tend to underestimate official GDP growth in countries where agriculture is more important. Arguably, night lights pick up secondary and tertiary activities though not unlit agriculture. This seems to be confirmed by the data: the association between lights and GDP is substantially stronger in countries where agriculture is less important. This calls for the inclusion of other remote sensing data into the model, such as rainfall or vegetation indices.
Third, the first-cut subnational GDP estimates for Rwanda and Kenya have some surprises. For Rwanda, the three Districts of Kigali City account for 40% of national GDP, underscoring the lower scale of economic activity in the rest of the country. For Kenya too, there are a number of surprises. While Nairobi indeed has the highest estimated GDP of all counties, it only represents 13 percent of national GDP, a far cry from the 60 percent routinely aired in Kenya. Mombasa, widely deemed the second center of economic gravity, comes out as ninth (out of 47 counties) when estimating county GDP based on nightlights. However, we emphasize that the estimates are exactly that: estimates. The results are open for discussion and debate.
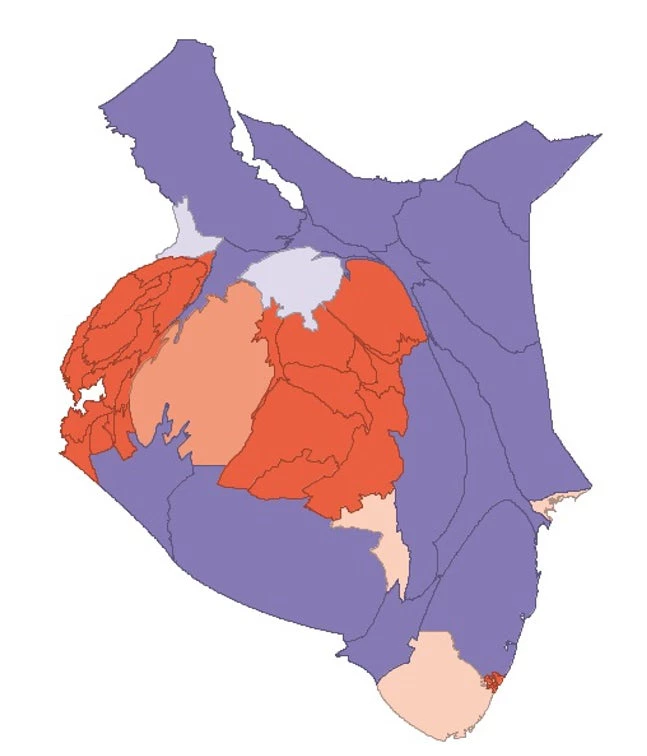
Comparing the actual County-map of Kenya (Figure 3) with the distorted map where county size is adjusted for estimated GDP (Figure 4) shows that Nairobi and the surrounding or not-too-far-off counties (Kiambu, Nakuru, Machakos, Kajiado, Nyeri) form the economic heartland of Kenya. While these Counties are relatively small, accounting for 23 percent of national population, they contribute an estimated 44 percent to GDP. On the other side, the Counties in purple in Figure 4 are large in size), but are among the poorest in Kenya.
| Figure 3: Actual Countrymap of Kenya | Figure 4: Country & County map adjusted for estimated GDP |
 |
 |
So, what are the takeaways?
First, estimating subnational GDP is becoming increasingly policy relevant, especially in decentralized environments such as Kenya, where there is an ongoing debate on how many resources should be shared between the national government and subnationals. One possible criterion may well be subnational GDP.
Second, night lights data can be used to get fairly reliable estimates of economic activity, as we find out in our case, even in poorly-lit Africa. But there is ample scope for improvement. Capturing differences in agricultural performance through rainfall or vegetation data would likely improve the estimates, as would correcting for so-called overglow: brightness spreads out and spills over into neighboring counties, potentially allocating one county’s economic activity to another.
Third, given the way technology is advancing – who knows – perhaps someday we will be able to estimate not global, national or even subnational GDP…but individual-level GDP. If you think that’s, well, spaced out, think of the fact that we are now able to compute our individual contribution to global warming!


Join the Conversation