It’s 3/14, also known as Pi Day – a mathematics holiday to celebrate the irrational, transcendental number we learned in school, for the most part, to calculate the circumference or area of circles. While there are a number of fulfilling Pi(e) related activities you can indulge in, from feasting on scrumptious pies to chasing down the value of Pi (good luck!), it is also an apt moment to turn attention to where children across the world stand in mathematics achievement and other learning outcomes.
While countries have made impressive gains in access to education, a recurring theme is that not nearly enough learning is happening. The 2018 World Development Report (WDR) takes on the learning crisis and its possible underlying factors. The report also takes stock of a growing evidence base to identify key principles and effective interventions to improve learning, challenges in taking successful interventions to scale, and strategies to overcome those challenges.
In honor of Pi Day, we present in pie charts some mind-boggling statistics. These findings also motivate the themes of the WDR. (Read more about those themes here!)
What do we know about learning outcomes?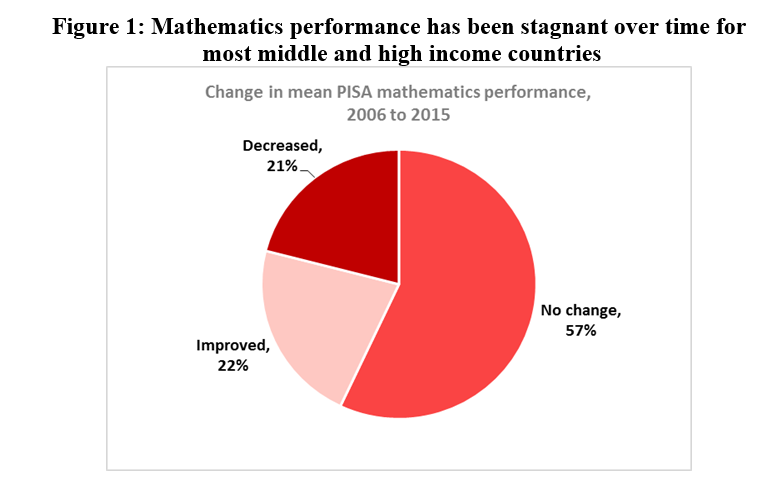
Source: WDR 2018 team calculations using data from OECD (2016)
In the last decade, 30 out of 53 countries participating in the PISA mathematics test experienced no change in performance.

Source: WDR 2018 team using data from LLECE (2013) and PASEC (2014)
On average, nearly 60 percent of 6th graders in 10 West African countries participating in the PASEC 2014 math assessment scored below the level considered sufficient for continued learning. This means that more than half of the students in these countries exit primary schools without being equipped to learn further. More than half of 6th graders in Latin America and the Caribbean countries perform at or below low competency.

Source: OECD (2016)
Seventy-five percent of 15-year olds in the Dominican Republic score below the 10th percentile score (373 points) for OECD countries indicating the wide gulf in learning between countries. In other middle income countries like Tunisia and Algeria, the 75th percentile math scores fall well below the 25th percentile for OECD countries. Similarly, the 75th percentile scores among lower secondary students in middle income African countries like Ghana, Botswana and South Africa fall below the 25th percentile for US secondary students in the TIMSS (2011).
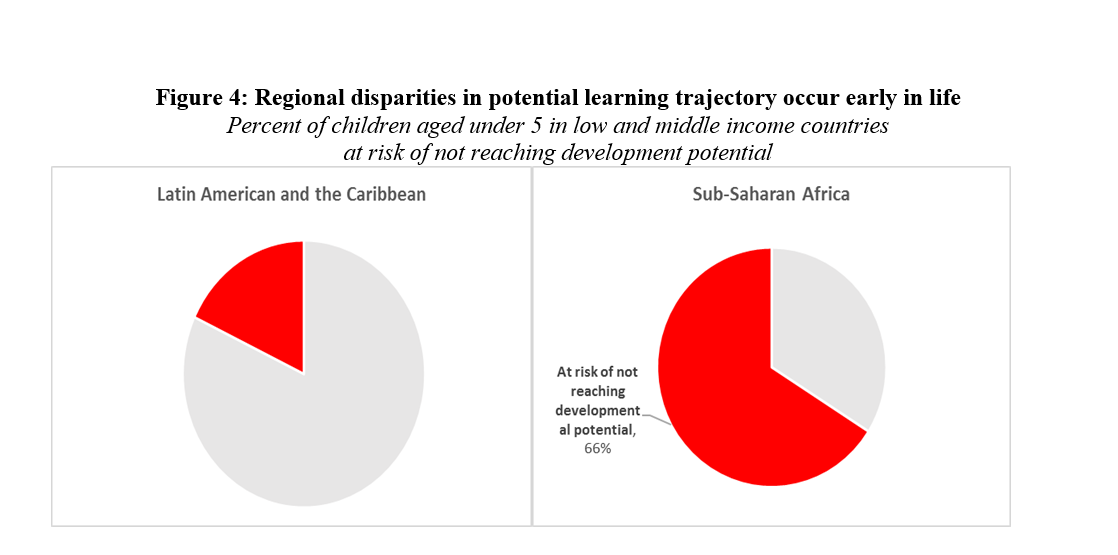
Source: Black et al (2017)
Stunting and extreme poverty under age 5 are both linked to adverse effects on children’s ability to learn to their full potential. While under 20% of children in low- and middle-income countries in Latin America and the Caribbean face this risk, 66% in Sub-Saharan African countries in similar income groups risk not reaping the full benefits of education.
What do we know about efforts to improve learning?

Source: Evans et al. education studies database (2017)
You may believe that we still have much to learn about what works (and what doesn't) to improve learning. That's true! But in the last decade, evidence on the effectiveness of programs has grown at an inspiring rate. For example, education impact evaluations- i.e., testing the effectiveness of an intervention, with student learning or access outcomes were relatively few and far between before the year 2000. From a recent review of reviews, more than 450 studies (>90% of studies) came out in the last 15 years. This evidence points to promising places for policymakers to start for their own local experimentation.
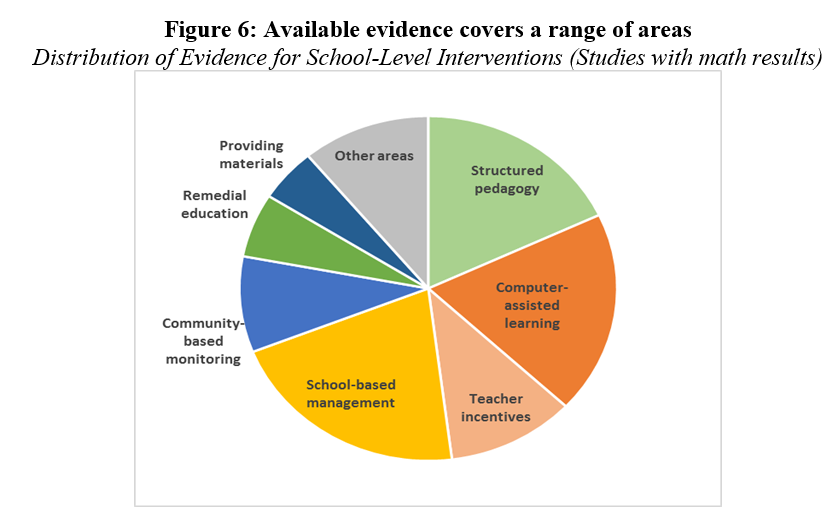
Source: Snilstveit et al. 2015
There are studies on improving pedagogy, using computers, decentralizing decision-making to schools, and more. But the variation within these areas can be significant: So what will work in a particular context depends on what is holding education back (the constraints!) and which interventions will open the door to advancement (relaxing the constraints!).
What do we still not know?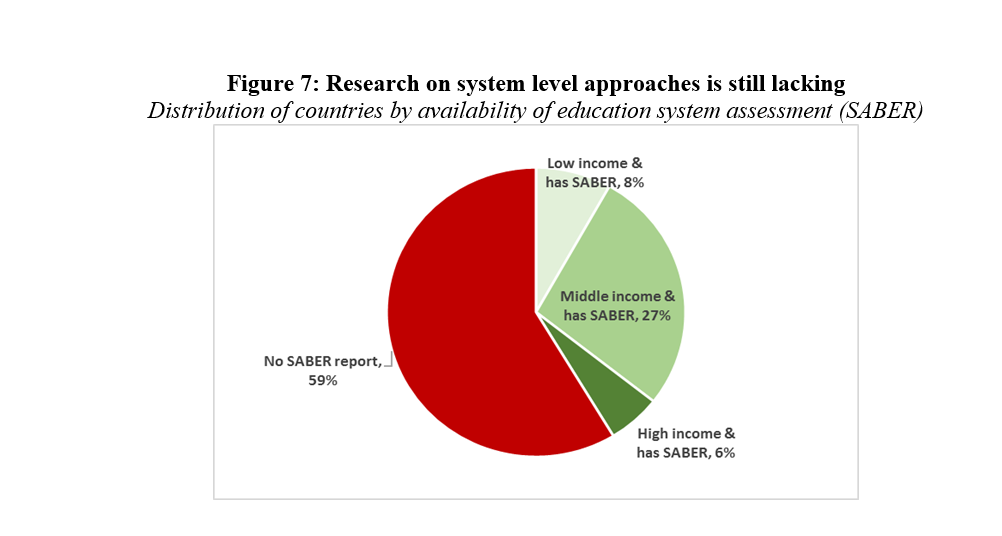
Source: WDR 2018 calculation using World Bank EdStats database
The parts of an education system all move together, which calls for a system level approach that can determine how changes in one part of the system are affected by the capacity in another part of the system. The World Bank’s Systems Approach for Better Education Results (SABER) assesses where countries stand on each component, and the Research on Improving Systems of Education (RISE) program takes a systems approach to researching how to improve learning. But relatively few countries are covered by these assessments.

Source: UNESCO (2016)
A UNESCO assessment of 121 countries in four regions found that more than 30 percent of countries lack any data required to report on mathematics proficiency levels for children at end of primary school. This number is higher for children at end of secondary school. Cross-nationally comparable data are even harder to find for low income countries. (See this map on the Learning Assessment Capacity Index.) Without good data on student performance, it is difficult to target interventions to improve it.
Clearly, much work needs to be done to enable all children to achieve their full learning potential. While countries can draw on the experiences of other education systems to identify starting points with potential, much of the knowledge on what works to improve learning will have to be home grown.
If these figures have whet your appetite to learn more, stay tuned for further blogs and background papers from the WDR 2018 team.
Contributions to this blog were made by Malek Abu-Jawdeh, Magdalena Bendini, Shwetlena Sabarwal, and Fei Yuan.


Join the Conversation