In January 2014, Oxfam released a widely-cited briefing paper which argued that the richest 85 people in the world owned more than the poorest half of the population in 2013 (Oxfam, 2014).
[1] In this blog post I estimate this statistic for Africa. The blog builds on background research for an upcoming flagship report “The State of Poverty and Inequality in Africa” led by the World Bank’s Africa Chief Economist Office. I find that the ten richest Africans own more than the bottom half of the continent.
Calculating this number requires two ingredients: (1) The wealth of the richest people, and (2) the distribution of wealth around the world (and by region) to estimate the total wealth of the bottom 50%.
The data used in both of these calculations are patchy, so these estimates should be interpreted with (a lot of) caution. To make matters worse, the two datasets refer to slightly different time periods and units of analysis. [2] The wealth of the richest individuals in the world is calculated by adding up the richest people on the list of billionaires published by Forbes magazine.
The second ingredient is obtained from estimates of the global (and regional) wealth distribution produced by Jim Davies, Rodrigo Lluberas and Anthony Shorrocks for Credit Suisse (Credit Suisse, 2014). From this distribution it is straightforward to obtain estimates of the wealth at the bottom. Because wealth surveys are much rarer than surveys of income or consumption, estimating the global (and regional) wealth distributions is a challenging task that requires a substantial amount of imputation across countries. [3] This is especially true for Africa, where the country-level wealth distributions are largely imputed from consumption surveys. [4] Furthermore, such an imputation approach could understate the wealth at the bottom in Africa where land is particularly important. [5]
Table 1 shows the (cumulative) regional and global distribution of wealth. These are the regions used by Credit Suisse (2014), which treats China and India as separate regions. Furthermore, Africa is defined geographically and thus includes Northern Africa, in contrast to the World Bank’s definition of Sub-Saharan Africa. For example, the table shows that the poorest 50% of Africans own 59bn USD in 2014. Note that the poorest parts of the wealth distribution in the rich countries (and the world) have negative wealth, i.e. a net debt. [6]
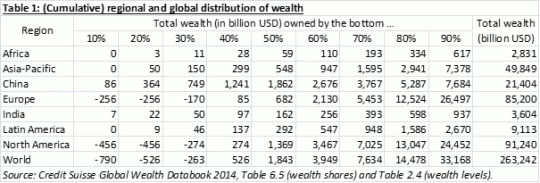
In the next step, I add up the wealth of the richest individuals in the Forbes list, starting from the top. [7] Table 2 shows the number of individuals whose wealth I need to sum up to reach the total wealth of a particular cumulative group. For example, the wealth of the three richest Africans exceeds that of the poorest 40% of the continent. The cells for the higher cumulative groups are missing when the total wealth of the groups reported in Table 1 exceeds the total wealth of the billionaires included in the Forbes list. [8] The bottom row reproduces the Oxfam result: The 75 richest people of the world own as much as the poorest 50% of the world. This compares with 85 people in Oxfam (2014) which used the 2013 edition of the Credit Suisse wealth report. [9] This suggests that over the last year, the wealth of the richest individuals has grown faster than the wealth of the bottom half of the global distribution.
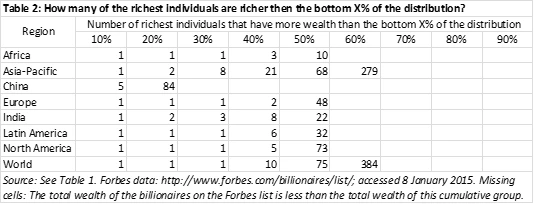
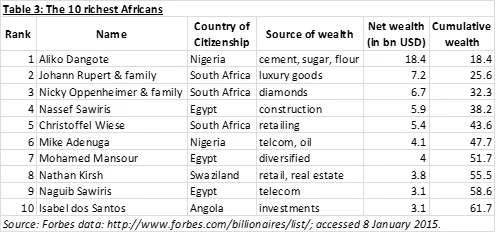
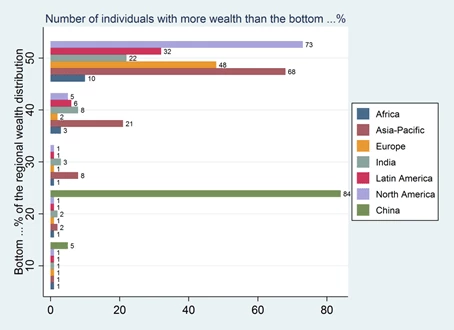
Table 3 lists the ten richest Africans together with their cumulative wealth. The ten richest Africans have more wealth (USD 62bn, see Table 3) than the bottom half of the continent’s population (USD 59bn, see Table 2). [10] Figure 1 compares this measure across regions, which has to be done carefully because population sizes differ across regions. [11] To reach the total wealth of the bottom 50% requires the total wealth of the 22 richest Indians, compared with the ten richest Africans. In China, the total wealth of the richest 5 individuals is only enough for the bottom 10%, while this would suffice for more than 40% of the poorest Africans.
Calculating global and regional wealth distributions is a complex exercise, which requires a number of assumptions and for which the data remain limited. But when following a methodology similar to Oxfam’s, the available data show that the ten richest Africans own more than the bottom half of the continent. Despite all the necessary caveats, this is a pretty grim illustration of the stark divide between the uber-wealthy and the rest.
Figure 1
References
Credit Suisse: 2014, ‘Credit Suisse Global Wealth Databook 2014’, Accessed 08 Jan 2015.
Davies, J. B., S. Sandström, A. F. Shorrocks and E. N. Wolff: 2011, ‘The level and distribution of global household wealth’, Economic Journal 121, p. 223-254.
Milanovic, Branko: 2015, ‘Repeat after me: Wealth is not income and income is not consumption’, http://glineq.blogspot.com/2015/01/repeat-after-me-weath-is-not-income-a..., 24 January 2015.
Oxfam: 2014, ‘Working for the few: Political capture and economic inequality’. Oxfam Briefing paper, 20 January 2014.
Oxfam: 2015, ‘Wealth: Having it all and wanting more’. Oxfam issue briefing, January 2015.
Vara, Vauhini: 2015, ‘Critics of Oxfam’s Poverty Statistics Are Missing the Point’, the New Yorker, http://www.newyorker.com/business/currency/critics-oxfams-poverty-statis..., 28 January 2015.
__________________________________
Calculating this number requires two ingredients: (1) The wealth of the richest people, and (2) the distribution of wealth around the world (and by region) to estimate the total wealth of the bottom 50%.
The data used in both of these calculations are patchy, so these estimates should be interpreted with (a lot of) caution. To make matters worse, the two datasets refer to slightly different time periods and units of analysis. [2] The wealth of the richest individuals in the world is calculated by adding up the richest people on the list of billionaires published by Forbes magazine.
The second ingredient is obtained from estimates of the global (and regional) wealth distribution produced by Jim Davies, Rodrigo Lluberas and Anthony Shorrocks for Credit Suisse (Credit Suisse, 2014). From this distribution it is straightforward to obtain estimates of the wealth at the bottom. Because wealth surveys are much rarer than surveys of income or consumption, estimating the global (and regional) wealth distributions is a challenging task that requires a substantial amount of imputation across countries. [3] This is especially true for Africa, where the country-level wealth distributions are largely imputed from consumption surveys. [4] Furthermore, such an imputation approach could understate the wealth at the bottom in Africa where land is particularly important. [5]
Table 1 shows the (cumulative) regional and global distribution of wealth. These are the regions used by Credit Suisse (2014), which treats China and India as separate regions. Furthermore, Africa is defined geographically and thus includes Northern Africa, in contrast to the World Bank’s definition of Sub-Saharan Africa. For example, the table shows that the poorest 50% of Africans own 59bn USD in 2014. Note that the poorest parts of the wealth distribution in the rich countries (and the world) have negative wealth, i.e. a net debt. [6]
In the next step, I add up the wealth of the richest individuals in the Forbes list, starting from the top. [7] Table 2 shows the number of individuals whose wealth I need to sum up to reach the total wealth of a particular cumulative group. For example, the wealth of the three richest Africans exceeds that of the poorest 40% of the continent. The cells for the higher cumulative groups are missing when the total wealth of the groups reported in Table 1 exceeds the total wealth of the billionaires included in the Forbes list. [8] The bottom row reproduces the Oxfam result: The 75 richest people of the world own as much as the poorest 50% of the world. This compares with 85 people in Oxfam (2014) which used the 2013 edition of the Credit Suisse wealth report. [9] This suggests that over the last year, the wealth of the richest individuals has grown faster than the wealth of the bottom half of the global distribution.
Table 3 lists the ten richest Africans together with their cumulative wealth. The ten richest Africans have more wealth (USD 62bn, see Table 3) than the bottom half of the continent’s population (USD 59bn, see Table 2). [10] Figure 1 compares this measure across regions, which has to be done carefully because population sizes differ across regions. [11] To reach the total wealth of the bottom 50% requires the total wealth of the 22 richest Indians, compared with the ten richest Africans. In China, the total wealth of the richest 5 individuals is only enough for the bottom 10%, while this would suffice for more than 40% of the poorest Africans.
Calculating global and regional wealth distributions is a complex exercise, which requires a number of assumptions and for which the data remain limited. But when following a methodology similar to Oxfam’s, the available data show that the ten richest Africans own more than the bottom half of the continent. Despite all the necessary caveats, this is a pretty grim illustration of the stark divide between the uber-wealthy and the rest.
Figure 1
References
Credit Suisse: 2014, ‘Credit Suisse Global Wealth Databook 2014’, Accessed 08 Jan 2015.
Davies, J. B., S. Sandström, A. F. Shorrocks and E. N. Wolff: 2011, ‘The level and distribution of global household wealth’, Economic Journal 121, p. 223-254.
Milanovic, Branko: 2015, ‘Repeat after me: Wealth is not income and income is not consumption’, http://glineq.blogspot.com/2015/01/repeat-after-me-weath-is-not-income-a..., 24 January 2015.
Oxfam: 2014, ‘Working for the few: Political capture and economic inequality’. Oxfam Briefing paper, 20 January 2014.
Oxfam: 2015, ‘Wealth: Having it all and wanting more’. Oxfam issue briefing, January 2015.
Vara, Vauhini: 2015, ‘Critics of Oxfam’s Poverty Statistics Are Missing the Point’, the New Yorker, http://www.newyorker.com/business/currency/critics-oxfams-poverty-statis..., 28 January 2015.
__________________________________
[1] As pointed out in Oxfam (2015), updated data puts this number at 92 (still referring to the year 2013).
http://oxfamblogs.org/fp2p/anatomy-of-a-killer-fact-the-worlds-85-riches...
[2] The unit of analysis in the Credit Suisse data are adults. The Forbes data include both individuals and families. The Forbes data are updated every trading day, i.e. they refer to January 2015 when I downloaded the data. The Credit Suisse data refer to mid-2014.
[3] As explained in more detail in Credit Suisse Global Wealth Databook (2014, p. 5), the method involves three steps. First, mean wealth is calculated for each country using household balance sheet data or household surveys which collect such information. Mean wealth is imputed for missing countries using a cross-country regression (Davies et al, 2011). Second, the distribution of wealth is estimated directly for countries which have a wealth survey. For most countries, however, the distribution of wealth is imputed from the income (or consumption) distribution, using the relationship observed in those countries where both sources of information are available. Third, the top tail of the country distributions is adjusted using the rich lists by Forbes magazine. In the calculation of the global patterns, missing countries are assigned the average level and distribution of their region and income class. This applies mostly to small and fragile countries.
[4] The only African country with an intermediate quality rating is South Africa, so for the overwhelming majority of African countries the data are imputed.
[5] The imputation uses the relationship between the income and wealth distributions observed in those countries where both sources of information are available. This sample of countries is likely biased towards richer countries, so it may not include many countries where very poor people (in income or consumption terms) own some land, which they use for subsistence. Yet, this may be substantial in Africa.
[6] This has attracted some criticism, which I will not address here (I would like to refer the interested reader to the excellent summaries by Milanovic (2015) and Vara (2015)). For my analysis, it suffices to say that the wealth of the bottom 10% of the African wealth distribution is positive.
[7] I use only the global Forbes list of billionaires. I do not exploit the Forbes rich lists for separate regions.
[8] The wealth of all billionaires included in the Forbes list adds up to USD 6,320bn, which accounts for 2.4% of global wealth (Table 1).
[9] Oxfam (2015), which uses an older version of the Forbes data together with Credit Suisse (2014), reports that in 2014 the 80 richest individuals owned as much as the poorest half of the world.
[10] With the Forbes data used by Oxfam (2015), this number falls to eight individuals.
[11] In other words, the bottom 50% represents a different number of people depending on the region. Here I compare Africa with China and India, which are roughly comparable in population size.

Join the Conversation