This page in:
Français
Commodity prices strengthened in early 2018, supported by supply and demand factors, including accelerated global growth, which has lifted demand for most industrial commodities, and supply constraints affecting others.
Chart 1: Commodity prices are forecast to rise across the board
The energy price index is anticipated to rise 20 percent in 2018, largely on strengthening of oil prices. The increase is a 16-percentage point upward revision from October 2017. Metal prices are projected to increase 9 percent in 2018 due to a further pickup in demand. Agricultural prices are forecast to gain more than 2 percent.
2018 commodity price rise forecasts (percent change from 2017 to 2018)
Source:
World Bank
Chart 2: Prices have upward momentum
Most commodity prices gained considerable ground in early 2018. Energy prices surged, led by oil and natural gas. The World Bank’s energy price index was twice as high in April 2018 as in 2016 Q1. Metals prices rose 4 percent amid strengthening global demand, tightening supplies, and trade frictions—the metals index is now 50 percent higher than 2016 Q1. Agricultural prices posted the largest quarterly increase in two years in 2018 Q1 because of reduced planting areas in North America and weather-related supply disruptions in South America. Agricultural prices are 10 percent higher than 2016Q1.
Commodity indexes since January 2011
Source:
World Bank
Chart 3: Geopolitical tensions pushed oil prices up
Oil prices have climbed since early April amid heightened geopolitical concerns. On May 8, the U.S. confirmed its intention to withdraw from the nuclear accord with Iran, further boosting oil prices. The price of Brent topped $80 per barrel on May 17.
Oil prices since the beginning of the year
Source:
World Bank
Chart 4: Oil producers are keeping their word
Oil price levels have been supported by production cuts by OPEC and some non-OPEC countries that began in January 2017. Compliance with the agreement setting production levels has been high and cuts have exceeded agreed-upon maximum levels. At its June meeting, OPEC and other producers are scheduled to consider whether to extend or amend output limits. Saudi Arabia reportedly prefers to target a price of $80 per barrel to fund an ambitious policy agenda. However, the impact of the cuts on prices has been broadly offset by rising output in other countries, notably the United States.
Compliance by OPEC and non-OEC countries with production agreement

Source: World Bank
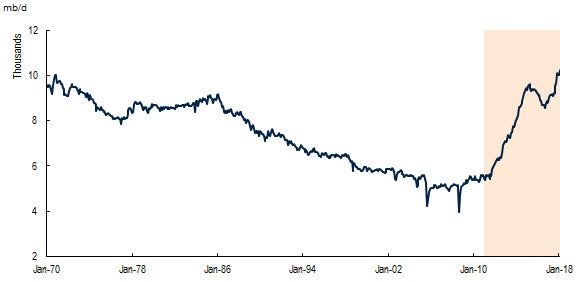
Chart 5: U.S. oil output has roared back
Thanks to higher prices and efficiency gains, shale oil production in the United Stated has rebounded in a big way. U.S. oil output reached 10.3 million barrels a day in April, a record high. The United States is the world’s second largest producer after Russia.
U.S. oil output reaches record high
Source: World Bank
Chart 6: Transportation bottlenecks are crimping U.S. oil production
The recent surge in U.S. shale oil growth took place in the Permian basin of West Texas. However, capacity constraints are increasingly starting to bite, which will restrict future increases in production. Transportation bottlenecks have made it very expensive to transport oil to Cushing, the main US oil hub, in turn causing Midland oil to trade at a considerable discount to WTI—the discount reached $10 per barrel in early May. New pipelines which will help ease these constraints are not expected to come onstream until the second half of 2019.
The Midland-Cushing price gap shows the effect of capacity constraints
Source:
World Bank
Chart 7: There may be less oil from Iran and Venezuela
Political turmoil in Venezuela and the resumption of sanctions against Iran are two major risks in the global oil market. Production in Venezuela dropped to a record low of 1.4 million barrels a day in April, half a million barrels a day lower than a year ago, and the International Energy Agency anticipates that production could continue to fall by several thousand barrels a day in 2018. The resumption of U.S. sanctions on Iran has driven much of the rise in oil prices since April. It is likely Iran could lose some, if not all, of the 1 million barrels a day it brought into the global market in 2016.
Iran and Venezuela oil output are key risks to global supplies
Source:
World Bank
Chart 8: Sanctions kicked up aluminum and nickel prices
Following several months of relative stability, aluminum prices surged in April following the U.S. imposition of sanctions against the world’s second largest aluminum producing company, Rusal. Nickel price also on fears sanctions could be extended to Russian producer Norilsk, which accounts for 9 percent of global nickel supplies. Prices have since eased somewhat on news that the sanctions may be less stringent than expected.
Aluminum and nickel prices

Source: World Bank
Chart 9: Grain supplies are tightening
The stock-to-use ratios (a measure of supply relative to demand) of two of the three main grains, which have been on the rise for several years, reversed course. Tightening supply conditions due to lower plantings in North America (a result of persistently low grain prices) and weather problems in South America, were the main reasons for this.
Grain stock-to-use ratios: slipping
Source:
World Bank


Join the Conversation