Bloggers here at Development Impact have written about “external validity” on a number of occasions (see
here and
here and
here and, well,
the list goes on). In short, how well will the effectiveness of an intervention in one place and time transfer to another place and time?
Of course, if you’re a policymaker trying to decide whether or not to implement a program that was effective (in some other place and time), you don’t only care about the impact. You also care about the price tag. To fill this gap, some researchers record costs to calculate the cost-effectiveness of an intervention: How much impact can you get for $100?
It’s not easy to say. As McEwan (2014) documents in his analysis of 77 education studies, “56% of treatments reported no details on incremental costs, while most of the rest reported minimal details.” We reviewed a few of these studies and found not-so-detailed cost documentation like “We estimate that the cost of implementing the grant was about US$321 (excluding the grant itself) per school,” That number may be useful, but without knowing what’s inside it, it’s pretty tough to build a comparison to other projects.
To begin to fill this gap, J-PAL has followed up with authors on a whole range of education studies to put together consistent cost-effectiveness estimates (for example, on teacher attendance, student attendance, and student performance). In a new paper, we used J-PAL’s data to dig a little deeper on the question of costs. Here’s what we found:
1. Costs vary a lot with geography. Context really matters for deciding what’s cost-effective.
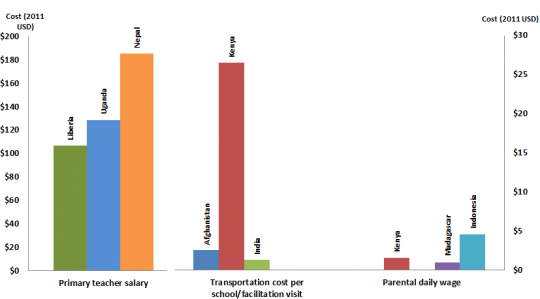
This isn’t hard to imagine. Just using J-PAL’s data, which at least makes an effort to be comparable, we compare some common cost ingredients across evaluations and see dramatic variation (per Figure 1 below). So if I were in Nepal, thinking about applying a successful intervention that increased student-teacher ratios in Liberia, the fact that primary teacher salaries are 80% higher in Nepal would really matter.
Figure 1: Cost of core components of education interventions across settings (in 2011 USD)
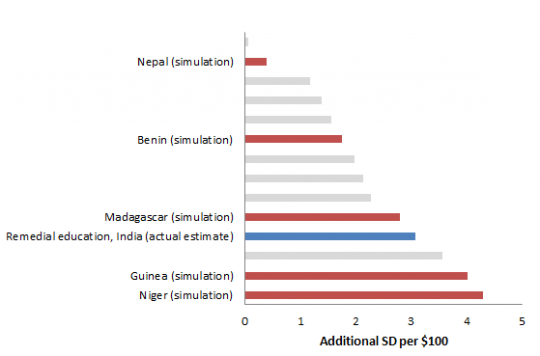
An added challenge is that a policymaker (or someone advising her) will often not have comparable data. One cost- effective education intervention provided remedial teachers to children falling behind in Indian primary schools. We wanted to know how much varying these teacher salaries would affect the cost-effectiveness estimates. But these aren’t regular teachers: They’re “community teachers,” usually high school graduates with not much training. No database we could find had salary numbers for community teachers. So we tried using survey data on high school graduate salaries to proxy for what “community teachers” would normally make. But this resulted in extremely low cost-effectiveness in every country we checked: In other words, high school graduates – on average – seem to make more than rural community teachers.
So we restricted our analysis to those countries where we could find data on community teachers. The results are in Figure 2. The cost-effectiveness of the actual program in India is presented in blue. The red bars are the cost-effectiveness values we get using community teacher salaries in other countries. The gray bars are the cost-effectiveness of other education interventions reviewed by J-PAL. As you can see, whether you think remedial teachers are the most cost-effective or the least cost-effective of the education interventions really depends on the context in which you’re going to place them. (Niger: Great! Nepal: Not so much.)
Figure 2: Simulated cost-effectiveness of improving learning using a remedial education program, using local data on the cost of community teachers
2. Costs vary a lot with program scale. Most of our evidence is on small-scale programs.
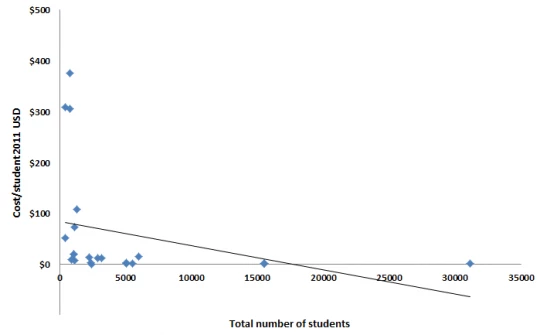
We all have the intuition that pilot programs are more expensive (and probably more effective) than programs at scale. These data allow us test this hypothesis on the cost side. For each intervention, we graph the cost per student against the total number of beneficiaries. You can see the result in Figure 3 below. It’s a small sample, but it certainly looks like costs drop as the number of students rise. But we also see major clumping towards the bottom: We have a lot more rigorous evidence on small programs than on big ones. The World Bank, J-PAL, and others are all seeking to evaluate more programs at scale, and it seems like every other week Professor Muralidharan is doing some new project with 80,000 students or 1,000 villages. But in the meantime, extrapolating costs from a rigorously evaluated pilot program to an at-scale program in another country will prove challenging.
Figure 3: Program cost per beneficiary student
3. Recall error may bias cost estimates downward.
We don’t have direct evidence for this in the context of costs (external validity, man!), but there is lots of evidence in consumption that people forget over time; here’s an application in Ghana, and one in India. It’s likely that cost estimates for programs – almost always reported well after the fact – suffer some of the same problem. It’s true that programs have budgets, but these budgets often group together items from multiple programs, and typically fail to capture most opportunity costs. It’s time to do with cost measurement what impact evaluations have begun to do with impact measurement: Start at the same time as the project starts.
4. Some programs will have more easily adaptable costs than others.
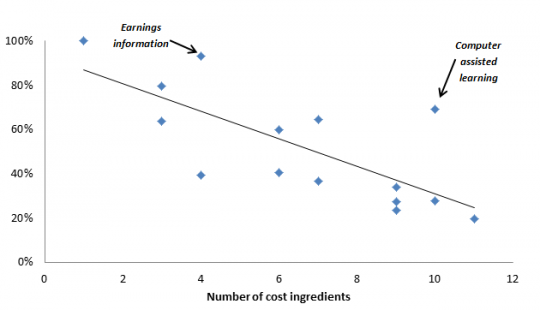
Across a sample of 14 education programs, the median number of total separate cost ingredients (e.g., teacher salaries, materials, transportation) was seven. For programs with a bunch of different ingredients, figuring out how much it will cost in another context is a lot of (guess)work. Figure 4 shows the number of cost ingredients against the total cost explained by the largest cost ingredients. For programs like computer-assisted learning, few ingredients explain most of the program, which may make it easier to get a sense of how to transfer it from India to Lesotho.
Figure 4: Percentage of cost explained by largest cost ingredient
5. The Take-away
If we want to be relevant to the policymaking process, we can’t ignore costs. But we also can’t continue reporting them badly. Detailed data, gathered as researchers go along, are crucial for making the leap to highly policy-relevant impact evaluations. Then policymakers and their advisors have the task of adapting those costs (and the impacts) at home.
For the avid reader:
Of course, if you’re a policymaker trying to decide whether or not to implement a program that was effective (in some other place and time), you don’t only care about the impact. You also care about the price tag. To fill this gap, some researchers record costs to calculate the cost-effectiveness of an intervention: How much impact can you get for $100?
It’s not easy to say. As McEwan (2014) documents in his analysis of 77 education studies, “56% of treatments reported no details on incremental costs, while most of the rest reported minimal details.” We reviewed a few of these studies and found not-so-detailed cost documentation like “We estimate that the cost of implementing the grant was about US$321 (excluding the grant itself) per school,” That number may be useful, but without knowing what’s inside it, it’s pretty tough to build a comparison to other projects.
To begin to fill this gap, J-PAL has followed up with authors on a whole range of education studies to put together consistent cost-effectiveness estimates (for example, on teacher attendance, student attendance, and student performance). In a new paper, we used J-PAL’s data to dig a little deeper on the question of costs. Here’s what we found:
1. Costs vary a lot with geography. Context really matters for deciding what’s cost-effective.
This isn’t hard to imagine. Just using J-PAL’s data, which at least makes an effort to be comparable, we compare some common cost ingredients across evaluations and see dramatic variation (per Figure 1 below). So if I were in Nepal, thinking about applying a successful intervention that increased student-teacher ratios in Liberia, the fact that primary teacher salaries are 80% higher in Nepal would really matter.
Figure 1: Cost of core components of education interventions across settings (in 2011 USD)
An added challenge is that a policymaker (or someone advising her) will often not have comparable data. One cost- effective education intervention provided remedial teachers to children falling behind in Indian primary schools. We wanted to know how much varying these teacher salaries would affect the cost-effectiveness estimates. But these aren’t regular teachers: They’re “community teachers,” usually high school graduates with not much training. No database we could find had salary numbers for community teachers. So we tried using survey data on high school graduate salaries to proxy for what “community teachers” would normally make. But this resulted in extremely low cost-effectiveness in every country we checked: In other words, high school graduates – on average – seem to make more than rural community teachers.
So we restricted our analysis to those countries where we could find data on community teachers. The results are in Figure 2. The cost-effectiveness of the actual program in India is presented in blue. The red bars are the cost-effectiveness values we get using community teacher salaries in other countries. The gray bars are the cost-effectiveness of other education interventions reviewed by J-PAL. As you can see, whether you think remedial teachers are the most cost-effective or the least cost-effective of the education interventions really depends on the context in which you’re going to place them. (Niger: Great! Nepal: Not so much.)
Figure 2: Simulated cost-effectiveness of improving learning using a remedial education program, using local data on the cost of community teachers
2. Costs vary a lot with program scale. Most of our evidence is on small-scale programs.
We all have the intuition that pilot programs are more expensive (and probably more effective) than programs at scale. These data allow us test this hypothesis on the cost side. For each intervention, we graph the cost per student against the total number of beneficiaries. You can see the result in Figure 3 below. It’s a small sample, but it certainly looks like costs drop as the number of students rise. But we also see major clumping towards the bottom: We have a lot more rigorous evidence on small programs than on big ones. The World Bank, J-PAL, and others are all seeking to evaluate more programs at scale, and it seems like every other week Professor Muralidharan is doing some new project with 80,000 students or 1,000 villages. But in the meantime, extrapolating costs from a rigorously evaluated pilot program to an at-scale program in another country will prove challenging.
Figure 3: Program cost per beneficiary student
3. Recall error may bias cost estimates downward.
We don’t have direct evidence for this in the context of costs (external validity, man!), but there is lots of evidence in consumption that people forget over time; here’s an application in Ghana, and one in India. It’s likely that cost estimates for programs – almost always reported well after the fact – suffer some of the same problem. It’s true that programs have budgets, but these budgets often group together items from multiple programs, and typically fail to capture most opportunity costs. It’s time to do with cost measurement what impact evaluations have begun to do with impact measurement: Start at the same time as the project starts.
4. Some programs will have more easily adaptable costs than others.
Across a sample of 14 education programs, the median number of total separate cost ingredients (e.g., teacher salaries, materials, transportation) was seven. For programs with a bunch of different ingredients, figuring out how much it will cost in another context is a lot of (guess)work. Figure 4 shows the number of cost ingredients against the total cost explained by the largest cost ingredients. For programs like computer-assisted learning, few ingredients explain most of the program, which may make it easier to get a sense of how to transfer it from India to Lesotho.
Figure 4: Percentage of cost explained by largest cost ingredient
5. The Take-away
If we want to be relevant to the policymaking process, we can’t ignore costs. But we also can’t continue reporting them badly. Detailed data, gathered as researchers go along, are crucial for making the leap to highly policy-relevant impact evaluations. Then policymakers and their advisors have the task of adapting those costs (and the impacts) at home.
For the avid reader:
- In the same paper, we also have a detailed discussion of how to incorporate the errors in impact estimates into cost-effectiveness measurement, but we’ll save that for another day.
- Dhaliwal et al. (2012) have a discussion of the pros and cons of cost-effectiveness versus cost-benefit analysis. They also discuss sensitivity of cost-effectiveness estimates to discount rates, exchange rates, etc.
- McEwan (2012) and Dhaliwal et al. (2012) each have nice descriptions of how one could measure (and then go on to report) costs.


Join the Conversation