As a research assistant working for David, I’ve had to create many, many regression and summary statistics tables. Just the other day, I sent David a draft of some tables for a paper that we are working on. After re-reading the draft, I realized that I had forgotten to label dependent variables and add joint significance tests in a couple regression tables. In an attempt to avoid forgetting these details in the future and potentially help future researchers, I thought I’d post a checklist for generating regression and summary statistics tables.
Like a first draft of a paper, a first draft of a Stata .do file is prone to typos and other errors. The awesome thing about scripting in Stata is that if there’s a scripting error, then Stata will error out and simply stop. However, if there’s a non-scripting error that affects the data, the .do file will generate flawed results without any warning! So, before sharing treatment effects regressions or summary statistics with co-authors or your PI, first make sure you can answer yes to the following questions.
If the answer is no to any of the above questions, then you know that you have to go back and make adjustments. If the number of observations in each regression is not consistent, then maybe you’re accidentally dropping observations. Or, maybe there’s a legitimate reason. Your regressions need not fit your initial hypothesis and often they won’t. But, the more out-of-sync your regression is with expectations, the more you should consider re-checking your underlying data.
For regressions on treatment effects, the control mean is often a clearer, simpler statistic than the constant term. A test for joint significance (the F-test) is informative because it reveals the likelihood that every interaction between covariates has no correlation with the dependent variable. The rest of the checklist simply involves crossing t’s and dotting i’s.
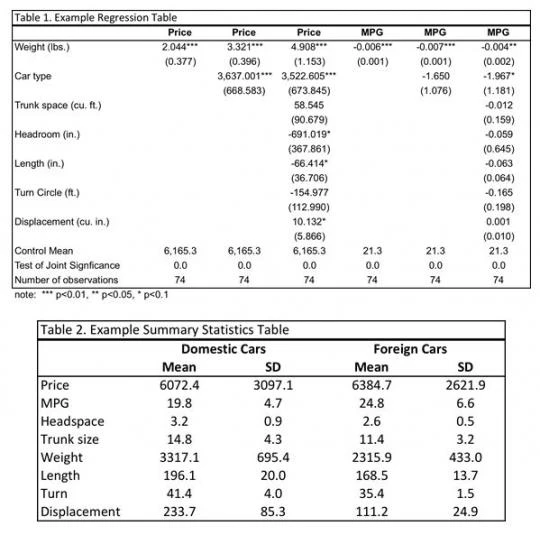
As a reference for generating publication quality tables, I’ve included two 10-step examples in Stata. These scripts rely on xml_tab and mat2txt for regression and summary statistics tables, respectively, but I try to make these packages easier to use by adding locals and walking you through. Below are example output tables (using system data) with very minor manual adjustments to add the control means and F statistic to the regression table and add borders and a title to both tables. The Stata code can be found here for regression tables and here for summary statistics tables.
Please add in the comments any other key items that should go in this checklist that you find yourself, your co-authors, or your RAs frequently forgetting
Like a first draft of a paper, a first draft of a Stata .do file is prone to typos and other errors. The awesome thing about scripting in Stata is that if there’s a scripting error, then Stata will error out and simply stop. However, if there’s a non-scripting error that affects the data, the .do file will generate flawed results without any warning! So, before sharing treatment effects regressions or summary statistics with co-authors or your PI, first make sure you can answer yes to the following questions.
- Does the number of observations for each regression or summary statistic make sense?
- Do the magnitude and sign of each coefficient/summary statistic seem reasonable?
- Did you delete the constant term and add the control mean in the regression table?
- Did you check for joint significance of your covariates?
- Did you label the dependent variables/columns?
- Did you label the covariates/rows?
- Did you add a title?
- Is it clear what the estimation procedure is (e.g. regression vs. probit)?
- Are the column widths the right size so as not to cut off text?
- Is the bordering consistent with your other tables?
- Are the numbers rounded to an appropriate level, so you don’t display too many decimal places?
- Do the notes to the table clearly indicate how standard errors have been estimated, and what control variables if any have been included but not shown?
If the answer is no to any of the above questions, then you know that you have to go back and make adjustments. If the number of observations in each regression is not consistent, then maybe you’re accidentally dropping observations. Or, maybe there’s a legitimate reason. Your regressions need not fit your initial hypothesis and often they won’t. But, the more out-of-sync your regression is with expectations, the more you should consider re-checking your underlying data.
For regressions on treatment effects, the control mean is often a clearer, simpler statistic than the constant term. A test for joint significance (the F-test) is informative because it reveals the likelihood that every interaction between covariates has no correlation with the dependent variable. The rest of the checklist simply involves crossing t’s and dotting i’s.
As a reference for generating publication quality tables, I’ve included two 10-step examples in Stata. These scripts rely on xml_tab and mat2txt for regression and summary statistics tables, respectively, but I try to make these packages easier to use by adding locals and walking you through. Below are example output tables (using system data) with very minor manual adjustments to add the control means and F statistic to the regression table and add borders and a title to both tables. The Stata code can be found here for regression tables and here for summary statistics tables.
Please add in the comments any other key items that should go in this checklist that you find yourself, your co-authors, or your RAs frequently forgetting

Join the Conversation