This is the seventh paper in our series of guest posts by graduates on the market this year.
Stratification is a widely used tool in randomized controlled trials. However experimenters often face the following situation: they are ready to assign treatment, they have a rich amount of information about each unit in the randomization, they would like to ensure that the treatment and control groups are similar with respect to these variables, but they must trade off balance on some variables versus others. In cases where there are many, possibly continuous, variables how should randomization proceed?
Matched pair designs solve the dimensionality problem by assigning each of the subjects in the experiment into pairs and picking one subject in each pair to receive treatment. This takes the stratification to the limit of what is possible with half the number of strata as units in the experiment and exactly two units within each stratum. Now the question becomes, how to assign pairs. My job market paper finds an optimal way to select pairs in matched pairs designs. I consider the key comparison in many experiments, the difference in average outcome between the treatment and control groups, and I show that using all baseline information to form a prediction of the outcome of interest and then stratifying based on that prediction minimizes the variance of the estimator.
Let's take for example school administrators who want to test interventions that increase student performance as measure by exam scores. Eighteen elementary schools have volunteered for an experiment and students in nine schools will receive an intervention (Fryer, 2013). Detailed administrative records have been kept for each school and for each student. So at the beginning of the study, researchers have a large set of baseline variables: graduation rates, previous exam scores, grades, attendance, proxies for family income, local crime, and many others.
A matched-pair randomization will put the eighteen schools into nine pairs, and one of the two schools in each pair will be assigned treatment. This paper shows that an optimal way to choose the nine pairs is to (1) use all available baseline information to predict exam performance at each school, (2) rank schools according to this prediction, and (3) match pairs by assigning the two highest ranked schools to one pair, the next two highest to the second pair, and so on until the two lowest ranked schools are assigned to the last pair. This will require data to estimate prediction functions. In this example, the estimation can be done using information from previous school cohorts.
The difference in means is typically the key finding from a randomized experiment (Angrist and Pischke, 2010) and my design minimizes the variance of this estimator. Estimators that are easy to explain also aid in the delivery of research findings to policy makers.
What are the assumptions?
- The treatment effect is independent of the predicted outcome. (This is a strong assumption. My paper also discusses finding computational solutions to the matching problem without this assumption.)
- The experimenter is interested in measuring impact using the difference in average outcome between treatment and control.
- The goal of the stratification is to minimize the variance (or maximize the precision) of this estimator.
- At the point of randomization there is information about how the baseline variables relate to the outcome of interest.
- All units are randomized at the same time.
How does this work in practice?
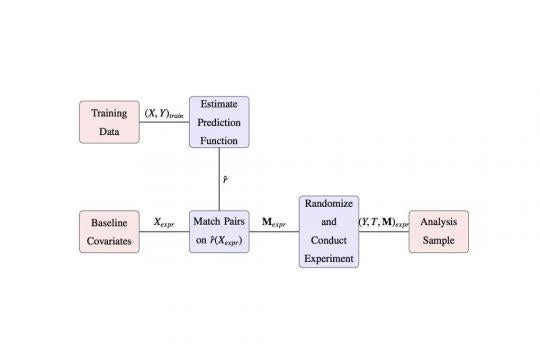
The figure above illustrates the steps involved in the matching procedure. The process starts with baseline variables for the units in the experiment , and with “training data" the key feature of which is that both baseline variables and the outcome are observed (often for a previous cohort). A prediction function that maps covariates to outcomes is estimated from the training data. I go over methods that prevent over-fitting at this step. The baseline covariates from the experiment are then brought in and a prediction of the outcome for each one is made. The predictions are ranked, and pairs are made based on the ranking. In the figure represents pair indicators. Next treatment is assigned, the experiment is done, and outcomes are measured. The ex-post analysis of the experiment is standard ( Duflo et al., 2006) and uses just the outcome , the treatment , and pair dummies where indexes individuals and indexes pairs. Inference can be conducted by fitting the model .
How well does this do in practice?
Using data from Bruhn and McKenzie (2011), I conduct simulations of six experiments. The settings are modeled on plausible or actual development field experiments. Mexico’s national labor survey simulates a treatment that increases income. A Sri Lankan micro-enterprise survey simulates an intervention that increases firm profits. A Pakistani education survey is used in simulated experiments that increase education and height. Finally Indonesia’s Family Life survey is used to simulate interventions that increase child schooling and household income.
For the simulations, I use the survey samples as the population and independently draw training and experiment samples. The former is used to fit a prediction model, and the later is taken as the experiment sample where only baseline variables are known at the point of randomization and outcomes are observed after.
I vary the number of observations from 30 to 300 in the experiment sample and the number of observations in the training data from 2000 to 100. In each case I estimate the prediction function using four common prediction techniques: Lasso, Ridge regression, and model selection based on AIC and BIC and match based on each one. For comparison I also match based on the baseline value of the outcome when available.
Simulation Results:
- I find that optimal designs have mean squared errors 23% less than completely randomized designs, on average. In one case, mean squared error is 43% less than randomized designs.
- Matching on the predicted value of the outcome always does as well or better than matching just on the baseline value of the outcome.
- Among the four prediction methods all perform equally well in five of the six experiments. In the remaining case (using Indonesian data with household expenditure as an outcome) Lasso and Ridge perform better than AIC and BIC.
- The experiments where the baseline data had the highest predictive power showed the biggest increases in relative precision compared to complete randomization. The relative gains, relative to complete randomization, were the same across sample sizes.
- The reductions in relative mean squared error come close (except in the case of Indonesian household expenditures) to that achieved under perfect balance on baseline variables.
- The relative decrease in variance from matching can be fairly well approximated by using the from the model fit in the training data.
Limitations:
There won't always be available training data from the same population as the experiment. With matching based on imprecise predictions there would possibly be gains from adjusting for covariate imbalance ex-post as in Rubin (1973). A strong assumption, that the treatment effect is independent of the predicted outcome, yields an analytic solution. My paper discusses optimizing in the more general case.
Conclusion:
I derive a method for optimal pairing in matched-pair randomization that minimizes the variance of a common estimator. I find that all covariate information relevant to precision is contained in the conditional expectation function. This method shows how information beyond the variables for the sample in the experiment can be used to inform randomization.
Thomas Barrios is a PhD student at Harvard University and is on the job market this year. His primary research interests are randomized experiments and investments in education.

Join the Conversation