Guest post by Abhijeet Singh
Last week on this blog, David wondered whether we should give up on using SDs for comparing effect sizes across impact evaluations. I wish that question was asked more often in the field of impact evaluations in education, where such comparisons are most rife. In this post, I explore some of the reasons why such comparisons might be flawed and what we might do to move towards less fragile metrics.
Dispersion is not constant across populations
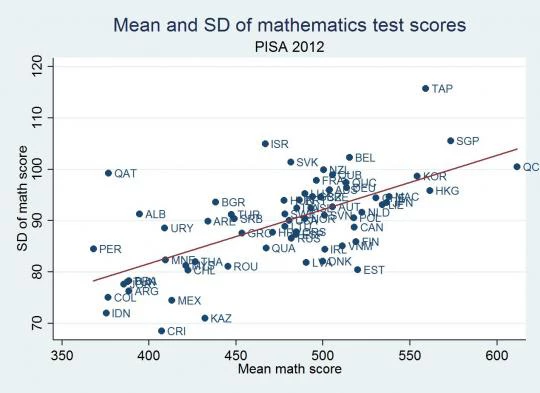
The most fundamental issue with such comparisons is that standard deviations are merely a measure of dispersion – and this is not constant across samples. So an intervention delivering the same absolute increment in learning would look less effective in a context with high variance in test scores than in another with low variance. These differences can be important. In the 2012 PISA assessment in math, the SD of test scores was 75% lower in Costa Rica than in Taiwan. On the same test and at the same age. So, like David’s hypothetical example in his post, the impact of an identically-effective (in absolute terms) intervention in Costa Rica will look 75% larger than in Taiwan.
More worryingly, it is possible that SDs differ systematically across samples. Plotting the PISA SDs against the mean achievement, measured SDs do seem to be greater in higher-scoring countries (see graph). Dispersion may increase with grade levels as the learning for lower-achieving students stagnates but the top-end of the class keeps progressing (a pattern that Karthik Muralidharan documents in Andhra Pradesh).Dispersion is also plausibly sensitive to policy – for example, interventions that focus on only one part of the distribution (e.g. remedial education) should, if effective, affect dispersion! Practically all other empirical work in economics recognizes that variance differs across samples – we typically take the SD of variables as a descriptive statistic to be reported – so it is very odd that implicitly we disregard this completely when comparing test score impacts.
Empirical vs. `true’ SDs: test design and aggregation issues
Differences in ‘true’ dispersion aren’t the only problem in using SDs as a metric of comparison. A student’s knowledge of a subject is a latent variable which we seek to evaluate using achievement tests. Equally important, and even less appreciated, issues arise from the methods by which we test individuals and generate aggregate scores.
The first issue relates to test design. Tests typically contain multiple test questions and can be of varying length and complexity. In general, differently designed tests will give differently shaped distributions and recover different estimates of SD; for example, the SD can be very sensitive to ceiling and floor effects which are pretty common depending on if the test was ‘too short’, ‘too hard’ or ‘too easy’. Given the wide variety of tests out there – ranging from the uber-simple four-category ASER tests to complex, sophisticated international testing programs like PISA – this is probably an important ground to be worried about when comparing SDs.
A separate issue relates to aggregation. While tests typically administer a series of individual items to respondents, we need aggregate test scores for our regressions – but how we generate these aggregates differs a lot across studies. At the simplest level, imagine a test contained 10 questions of varying difficulty – one way to generate an aggregate would be to add up the number of correct responses but another (perhaps more conceptually valid?) way would recognize the different difficulty levels of the test questions and weight them accordingly in generating a score (e.g. by assigning addition problems 1 point and division problems 3 points). Instead of using arbitrary weights, you could even use complex Item Response theory (IRT) models to estimate item difficulty, like PISA, TIMSS or the GRE and the SAT do(see this article for a good econ-oriented intro). Depending on which method you choose, the dispersion (and therefore comparisons with other samples), could change radically.
Does this matter?
How important is this in practice? As it turns out, quite a lot. In a recent paper (JDE 2015, ungated version here), I show that when using an (unweighted) raw score, private schools in rural India appear to have an impact of about 0.28 SD on English test scores, a figure nearly identical to figures reported in Muralidharan and Sundararaman (2013) who also score tests similarly; however, using a normalized IRT score, the estimated impact is more than 0.6 SD. When the composite score is disaggregated by type of question, I show the greatest proportional increase is on ‘harder’ questions i.e. those with the lowest baseline probability of being answered by government school students; this suggests that the vast difference in the point estimates arise from the different weighting schemes imposed by the two procedures. Even the choice of which IRT model to use is important and can change the dispersion significantly (as this paper documents, with the greatest sensitivity in developing countries!). The point here is not to advocate one weighting procedure over the other but to just point out that comparisons in SDs are very much dependent on these issues which typically aren’t even discussed in the Data appendices of most papers.
What this means in interpreting results and how we could improve
At the very least, this suggests that we shouldn’t rely too much on SDs from different surveys with different tests and scoring procedures, across varying contexts, for comparing impact size as in recent meta-analyses or using “SDs-per-dollar” as a metric for cost-effectiveness: the underlying metric is just too fragile and without a clear conceptual basis. Moreover, this indicates that the general rules-of-thumb in the literature about what is a ‘small’ or a ‘large’ effect (e.g. 0.3 SD being large, as used by JPAL in interpreting their results) are also not necessarily too reliable or based on conceptually firm foundations. A silver lining is that this doesn’t change our reading of the literature too much: the key finding from the meta-analyses is just how many classes of interventions have no impact. A zero is still a zero regardless of these issues – they shouldn’t change the existence or sign of an impact (although they might change statistical significance?).
But what can we do better? After all, we would like to have a coherent picture emerge from the hundreds of studies in this area! There are a number of possible improvements, none of them sufficient by itself, which should help:
- Report impact sizes not just for the aggregate score but also for a subset of tasks or competences (e.g. the ability to solve a division problem or to read a sentence). This has a few advantages: first, it is more transparent and easily understood than an impact size in SDs; second, it allows for some retrospective comparison of effect sizes for studies that have already been carried out; third, it requires minimal coordination between research teams regarding the design of the tests.
- Where tests ask the same type of questions (e.g. addition in Grade 2), keep the questions identical across studies. With enough common items across studies, these tests can be linked through IRT methods. This is standard in the large scale educational assessments literature and a better conceptual basis for both measurement and comparisons. Although it doesn’t solve all issues, as this excellent if somewhat depressing article points out, it’s a lot better than a raw sum.
- When researchers archive data, they should not only archive the test score but also the individual items used to create the scores (also ideally the do files of how the scores were created). This is not the current norm and means that any replicators cannot test for sensitivity to the issues discussed here.
- Discuss the sensitivity of the estimates to these issues, even if in an online appendix.
There is probably no other major class of outcome variable in empirical economics that we accept as uncritically as test scores. And progress isn’t necessarily too hard. If there did exist a large enough item bank, at least on some subjects like math and English which are tested across contexts, then individual researchers could use it to administer at least a subset of common items in their own tests. This alone could greatly aid comparability. The development of such an item bank is labour-intensive but perhaps exactly the kind of enterprise that it would be good for large organizations such as the World Bank or OECD or MIT-JPAL to undertake – providing a public good that improves the standards in the entire field. The World Bank did it for survey design through the excellent blue books from the LSMS studies and for the development of consumption aggregates. The WHO did it with developing anthropometric reference standards which are used by all researchers working on child undernutrition (where again SDs are used for impact size but being based on a global reference distribution and with identical measurement and scaling, avoid the issues I outline here). There is no reason to not do this for educational testing as well.
Abhijeet Singh recently completed his DPhil (PhD) in Economics at the University of Oxford and currently works as a Research Officer with the Young Lives study.

Join the Conversation