I love a great discontinuity!
Most of my own evaluation work has centered around randomized trials, but when I teach non-experimental IE methods, regression discontinuity is my favorite to teach. Regression discontinuity is, in short, when assignment to a development program is made based on some sort of score (e.g., a poverty score or a test score), and we compare the people immediately above and below the score to each other, since they should be very similar except for (a) a few points on a test score and (b) some people received the program! Here is why I like teaching it:
Pugatch & Schroeder (2013) analyze the impact of hardship allowance for teachers in the Gambia, using the required threshold in distance from the main road to qualify for the allowance.

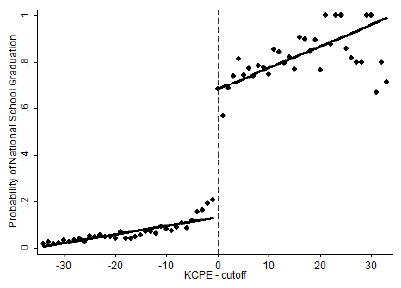
Ozier (2011) examines the impact of secondary school in Kenya on schooling, social, and labor market outcomes, using the fact that students need a pass on the primary exit exam in order to enter secondary school.

Mbiti & Lucas (2013) test the impact of secondary school quality on student achievement in Kenya, using the cut-off on the primary exit exam required to get into better secondary schools.

Clemens & Tiongson (2012) use a language test in the Philippines that permitted workers to travel to Korea, in order to see impacts on household investments.

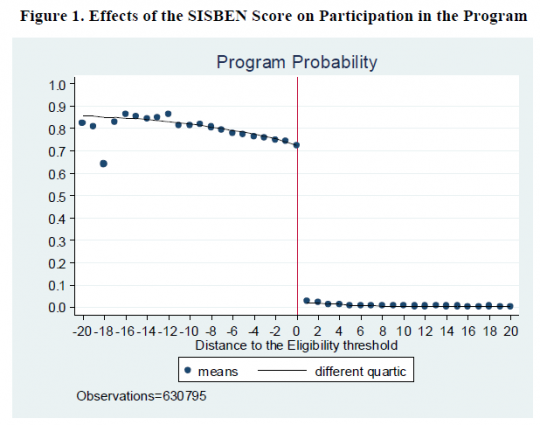
Baez & Camacho (2011) examine the impact of conditional cash transfers on education in Colombia using a poverty score.

Kazianga et al. (2013) estimate the impact of constructing girl-friendly schools in Burkina Faso on school enrollment, using the school's score in terms of the number of girls likely to benefit from the school.
 Urquiola & Verhoogen (2009) show how
schools make different policy decisions when they are close to class size limits, violating some of the assumptions of regression discontinuity analysis. But the figure is still striking.
 Barrera-Osorio & Raju (2011) analyze the
impact of subsidies to private schools in Pakistan using the fact that schools had to achieve a certain average on an achievement test.

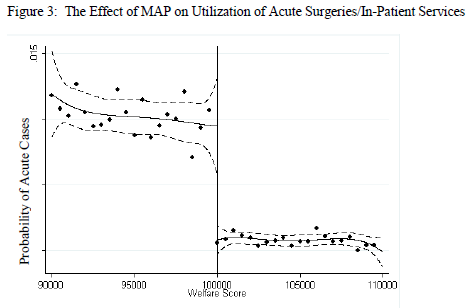
The figures can be even more striking when, rather than showing the discontinuity in the relationship between your score and participation in the treatment, they demonstrate the discontinuity in the relationship between your score and the outcome we care about, as in those figures below.
Hou & Chao (2008) show the impact of means-tested health insurance on medical procedures in Georgia.

Manacorda, Miguel, & Vigorito (2011) used the cut-off in income eligibility in a large anti-poverty program in Uruguay to show how the program significantly increased political support for the incumbent party.

Ali, Deininger, & Goldstein (2013) use spatial discontinuities in Rwanda to evaluate the impact of land tenure regularization. (The working paper version, without the great visuals, is here.)

Apparently Reichardt, Trochim, and Cappelleri were right almost twenty years ago when they entitled their paper “ Reports of the Death of Regression-Discontinuity Analysis Are Greatly Exaggerated.”
There are many more regression discontinuity papers, but not all with the same impressive figures.
Most of my own evaluation work has centered around randomized trials, but when I teach non-experimental IE methods, regression discontinuity is my favorite to teach. Regression discontinuity is, in short, when assignment to a development program is made based on some sort of score (e.g., a poverty score or a test score), and we compare the people immediately above and below the score to each other, since they should be very similar except for (a) a few points on a test score and (b) some people received the program! Here is why I like teaching it:
- It’s intuitive, and I can explain it to a non-economist policymaker (“We just compare the people right above and below the cut-off!”);
- Once you show that the index or score predicts a jump in receiving a program or a scholarship or whatever, and then that other variables are smooth along that score (i.e., your mother’s education doesn’t leap when you reach 100 on the poverty score), the estimates of program impact can be genuinely credible (of course, this still requires assumptions determining how close to the cut-off we use observations);
- Unlike with some other non-experimental estimates (I’m looking at you, certain applications of IV!), it’s clear who we’re estimating the effect for (people around the cut-off), and I find that population interesting (if we expand the program, we’re probably expanding it to people around the cut-off);
- The graphs are fabulous!
Pugatch & Schroeder (2013) analyze the impact of hardship allowance for teachers in the Gambia, using the required threshold in distance from the main road to qualify for the allowance.

Ozier (2011) examines the impact of secondary school in Kenya on schooling, social, and labor market outcomes, using the fact that students need a pass on the primary exit exam in order to enter secondary school.

Mbiti & Lucas (2013) test the impact of secondary school quality on student achievement in Kenya, using the cut-off on the primary exit exam required to get into better secondary schools.

Clemens & Tiongson (2012) use a language test in the Philippines that permitted workers to travel to Korea, in order to see impacts on household investments.

Baez & Camacho (2011) examine the impact of conditional cash transfers on education in Colombia using a poverty score.

Kazianga et al. (2013) estimate the impact of constructing girl-friendly schools in Burkina Faso on school enrollment, using the school's score in terms of the number of girls likely to benefit from the school.


The figures can be even more striking when, rather than showing the discontinuity in the relationship between your score and participation in the treatment, they demonstrate the discontinuity in the relationship between your score and the outcome we care about, as in those figures below.
Hou & Chao (2008) show the impact of means-tested health insurance on medical procedures in Georgia.

Manacorda, Miguel, & Vigorito (2011) used the cut-off in income eligibility in a large anti-poverty program in Uruguay to show how the program significantly increased political support for the incumbent party.

Ali, Deininger, & Goldstein (2013) use spatial discontinuities in Rwanda to evaluate the impact of land tenure regularization. (The working paper version, without the great visuals, is here.)

Apparently Reichardt, Trochim, and Cappelleri were right almost twenty years ago when they entitled their paper “ Reports of the Death of Regression-Discontinuity Analysis Are Greatly Exaggerated.”
There are many more regression discontinuity papers, but not all with the same impressive figures.


Join the Conversation