This post was co-authored with Espen Beer Prydz. The findings, interpretations, and conclusions expressed in this post are entirely ours. They do not necessarily represent the views of the World Bank and its affiliated organizations.
The Lancet recently published a paper by Pronyk et al. [ungated version] which examines the effects of the Millennium Villages Project (MVP) during its first 3 years in 9 countries. The paper has generated an editorial in Nature magazine along with reactions from Lawrence Haddad, Annie Feighery at UN Dispatch, Matt Colin at Aid Thoughts, Lee Crawfurd at Roving Bandit, and Tom Murphy at View from the Cave.
The key result from the paper is that
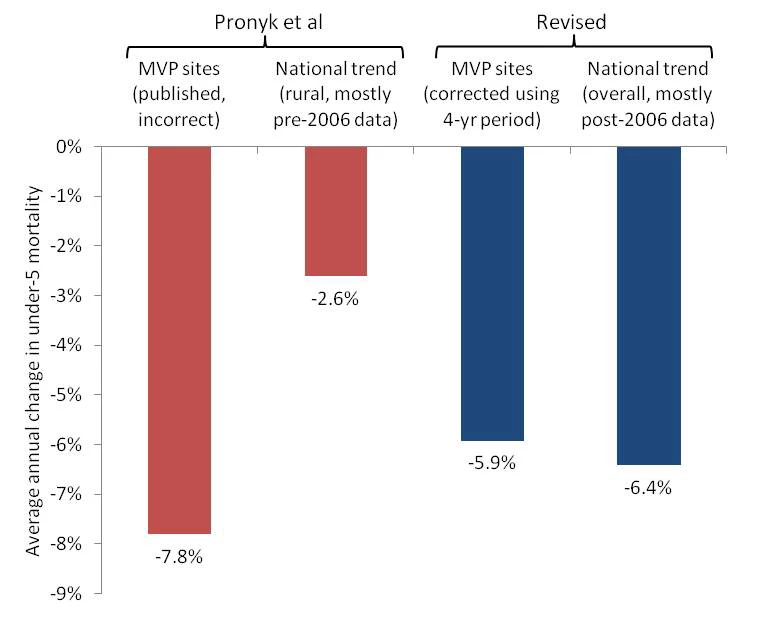
the average rate of reduction of mortality in children younger than 5 years of age was three-times faster in Millennium Village sites than in the most recent 10-year national rural trends (7.8% vs. 2.6%).
However, when we correct for a mathematical error and use more recent comparison data, we find that under-5 mortality has fallen at just 5.9% per year at MVP sites, which is slower than the 6.4% average annual decline in under-5 child mortality in the MVP countries nationwide.
Under-5 mortality is described in both the paper and the MVP research protocol as the primary outcome. There are two flaws to the Pronyk et al. under-5 mortality analysis. The first is the mathematical error that overstates the 7.8% rate of decline at the MV sites. The second is that the 2.6% national comparison figure is based mostly on a time period that predates both the MVP and an acceleration of mortality declines in the relevant countries. The most recent rural trend data available show even more rapid declines than the national trends.
The mathematical error is straightforward. Child mortality is inherently a retrospective measure, as it is derived from the survival probabilities for some period before a given survey. As the paper’s appendix explains,
For the purposes of the analysis, the “baseline” period is defined as the 5 years before the intervention started; the “follow‐up” period is the first 3 years of implementation.
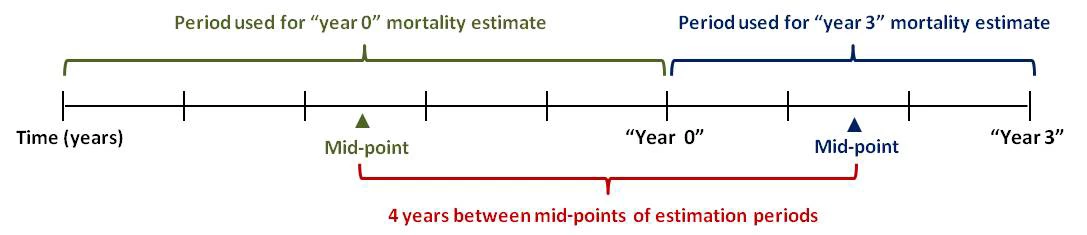
Thus the “year 0” or “baseline” mortality estimates in Pronyk et al. correspond to the 5-year period preceding the start of the intervention at “year 0.” The “year 3” or “follow-up” mortality estimates correspond to the 3-year period after the start of the intervention. The time elapsed between these two periods should be calculated from the midpoints of those two periods and is thus 4 years. This is shown graphically in the figure below. Pronyk et al. mistakenly treats this elapsed time as 3 years, yielding an average annual rate of decline of 7.8%. Using the correct elapsed time of 4 years, the true average rate of decline across the MV sites is 5.9%.
This somewhat subtle point may be clearer if one considers a reduction ad absurdum case. What would the correct elapsed time be for the calculation if the “follow-up” period were 3 years but the “baseline” period had been 30 years? Clearly, the elapsed time would not be 3 years, because the “baseline” period would cover the period of children’s lives and mortality risk from decades in the past, on average 15 years before the start of the intervention. (In this case, the elapsed time would be 16.5 years.) By the same logic, the mortality risk experience described by the 5-year “baseline” period took place at a point in time on average 2.5 years before the start of the intervention. The mortality risk experience described by the 3-year “follow-up” period took place at a point in time on average 1.5 years after the start of the intervention. Thus the correct elapsed time is 4 years, not 3.
The second flaw concerns the choice of comparison period for the national trends. Pronyk et al. present an estimated annual rate of decline in rural areas of the 9 countries as 2.6% over 2001-2010. However, this estimate is based largely on trends from the first half of the decade, before the MVP started in 2006, and the decline of child mortality accelerated dramatically in several countries around the middle of the decade. Additionally, Pronyk et al. do not use recent DHS data from Senegal and Uganda, which shows very rapid declines in under-5 mortality in those countries.
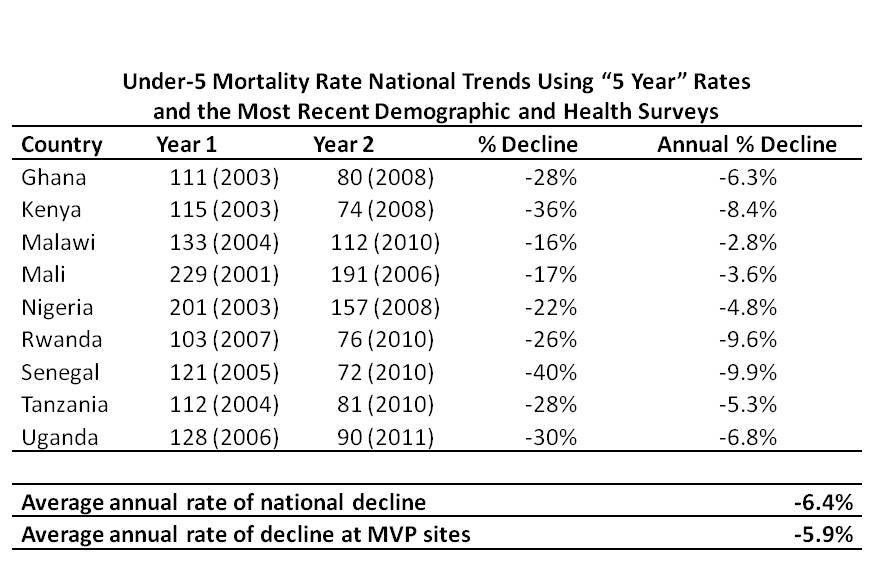
The table below shows the under-5 mortality trends at the national level, using the 2 most recent DHS in each of the 9 countries. These numbers in every case correspond to the 5-year period before the survey. (The figures come from published DHS reports and the Statcompiler tool on the DHS website. They are also in Table 1 of this paper.) On average, the annual rate of decline across the 9 countries is 6.4%, a faster rate of decline than the 5.9% across the MV sites.
Pronyk et al. use rural trend figures for each country (calculated for the 10-year period before each survey) rather than the national trend figures. For the 6 cases for which the information is available (Ghana, Kenya, Malawi, Nigeria, Senegal, and Tanzania) from the most recent DHS, and the most recent DHS was conducted after the start of the MVP, the rate of decline in rural areas is faster than at the national level, using 10-year rates.
It is possible that in the absence of the project, the experience at the MVP sites would have been substantially different than the national and rural trends. It is for this kind of reason that a rigorous impact evaluation is always based on a careful analysis of the counterfactual. Pronyk et al. do present findings from comparison sites. Earlier work co-authored by one of us, which was published in the Journal of Development Effectiveness, [ungated version] offered suggestions on improving the MVP evaluation and raised a number of concerns, including a detailed discussion of the issues regarding the validity of the comparison sites. Those concerns still apply and we will not revisit them here.
Overall, we observe that 1) under-5 mortality has declined more slowly at the Millennium Village Project sites than nationally in the countries where the sites are located, 2) child mortality is declining more rapidly in rural areas than nationally. The observations we have noted here help to highlight the importance of rigorous impact evaluation with credible counterfactuals to inform our understanding of development projects. Any discussion of “impact” or “effects” of a project must start with a determination of how to estimate the counterfactual, i.e. what would have happened in the places the project areas if the project had never taken place. The basis for estimating the counterfactual must be taken seriously and should not be, for example, a comparison site selected years after the start of the project, or national trends during a substantially different time period than that of the project. This general lesson from the MVP experience—think seriously about how to understand the counterfactual, before starting to implement the program—is one that can inform the MVP going forward as well as many other development projects, including not least those supported by the World Bank.

Join the Conversation