So you’ve designed an awesome impact evaluation, you’ve carried out a rich baseline survey, you’ve presented the baseline results to the government of Brigadoon, and now you….wait two years until the follow-up survey? What else can you do with this baseline data? You can do a lot! You can write a report, you can write a brief, you can publish papers, you can test targeting strategies, and you can even [drumroll] affect policy.
Use 1: Write a report. The baseline report is a useful way to bring all the results into one place. A recent baseline report for an impact evaluation of community-based education in Afghanistan has interesting descriptive data on school attendance, demand for education, and learning levels. A baseline report for an impact evaluation of agribusiness leaders in Ethiopia has data on business practices, why women start businesses, and financial habits. One for a cash transfer program in Malawi has useful data on household livelihoods and adolescent attitudes toward sex.
Of course, many of these come in at 100+ pages (or 350 pages across two volumes, in this extremely data rich example on education in Tanzania). Almost no one – including your government counterparts – is going to read your full report. Another downside of the baseline report (by itself) is that because a wide array of information is in one report (usually creatively entitled “baseline report”), there is no way for anyone to know that your report contains insightful data from the inside of Afghanistan’s classrooms or on the financial habits of Ethiopian entrepreneurs.
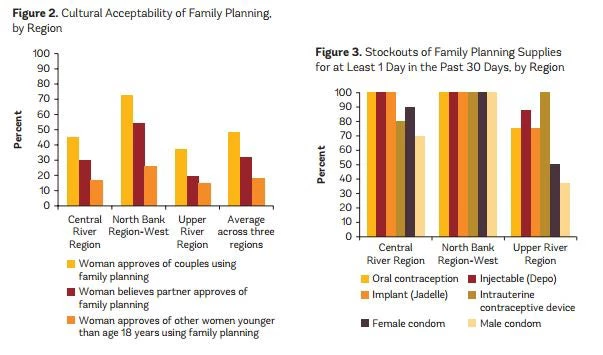
Use 2: Write a brief (or two). In the hopes that these data will be consumed, you can write one or more briefs, summarizing the most interesting descriptive data in 2-4 pages. For example, this three-page brief from the baseline of an IE of a nutrition and maternal health project in the Gambia summarizes data on the attitudes toward family planning and stockouts of family planning supplies. Another brief from the same baseline survey summarizes data on antenatal care and health worker knowledge.
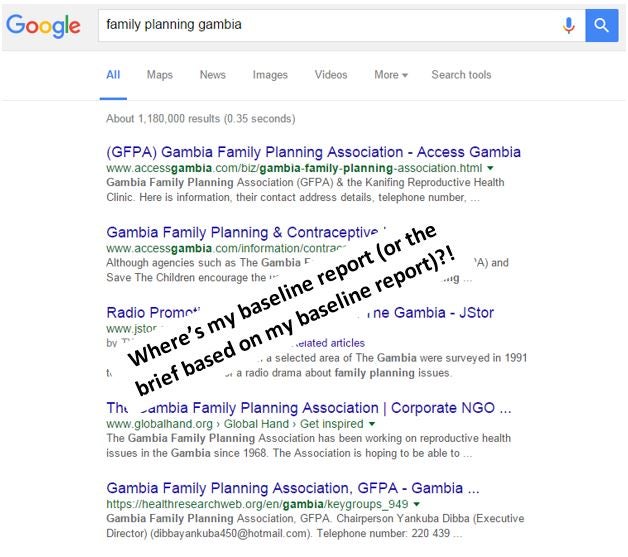
The nice thing about the brief is that because it’s just a few pages, you can share it much more easily. The downside is that the distribution mechanism, as for baseline reports, isn’t well established. You can hand the brief to people, you can e-mail it to people, and you can tweet about it, but it’s still unlikely to come up if someone is searching for data on family planning in the Gambia.
Use 3: Write a paper. An informal survey of papers (many thanks to colleagues and to Twitter) reveals that it is indeed possible to publish papers based on baseline surveys. These have the advantage that (1) they tend to be more focused than a general baseline report, and (2) they are in journals, both of which make them more findable to people who are working on the topic.
What do papers based on baseline surveys look like?
- Use novel descriptive data to illuminate an interesting phenomenon. For example, Banerjee et al. used a weekly absenteeism survey in health centers, along with other rich data, to characterize the relationship between health, wealth, and health services in one part of India. Gibson et al. used a survey of remittances to calculate the first estimates of the cost-elasticity of remittances. Lee et al. demonstrate a surprising fact, that electrification among households in rural Kenya are extremely low, even when they are in the vicinity of an existing electrical grid.
- Combine data from multiple baseline surveys. Naudeau et al. combined data on children’s cognitive development (as associated with socio-economic status and other variables) from a baseline in Cambodia and a baseline in Mozambique. McKenzie and Siegel drew from list experiments across 4 baseline surveys in 4 countries to elicit illegal migration rates. McKenzie and Woodruff asked similar questions on business practices across 7 baseline surveys and examine the relationship between business practices and business outcomes.
- Baseline Plus. Some studies use the baseline plus some additional information. For example, Akresh et al. used two rounds of a survey in Burkina Faso – but before any IE results – to examine child ability and human capital investment decisions. Diwan et al. and de Mel et al. used baseline data plus program uptake data to examine how the invitation structure for business training in Kenya or how the offer of wage subsidies affected the take-up of these programs.
- Add an experiment (or a thought experiment) to your baseline survey. De Martino et al. carried out a lab-in-the-field experiment in the course of a baseline in Brazil. Jayachandran included a series of hypothetical questions about preferred sex composition of children at different fertility levels. Increasingly common electronic survey administration makes tests of questionnaire design easier.
Across 11 published baseline-based papers that I identified that have been accepted for publication, I found examples in the American Economic Review Papers and Proceedings ( 1 and 2), PLOS One, Economic Development and Cultural Change, Public Finance Review, Management Science ( forthcoming), Development Engineering, Migration Studies, Pacific Economic Bulletin, Global Health: Science and Practice, and as a book chapter. So the median outlet is a field journal, with a few exceptions.
Across the 7 papers that had come out by the end of 2014, the Google Scholar median citation count is 22, which is lower but not radically lower than recent citation counts in top economics journals, per Card and DellaVigna. The average is higher (50), which compares very favorably to an economics-wide average published recently.
Use 4: Inform program design. One team I spoke with is using the baseline survey to figure out the best way to target future iterations of the program: Baseline data can be used to figure out which subsets of variables are most predictive of a larger, richer set of household characteristics.
Use 5: Affect policy. Even at the baseline stage, data from the impact evaluation can affect policy! David McKenzie has written about how, in response to his paper on the cost-elasticity of remittances for Tongan migrants to New Zealand, “This spurred an effort by the New Zealand Government and World Bank operational team to work to reduce the cost of sending remittances, leading to a change in a law in New Zealand that had limited one option for sending money cheaply and the development of a website to share information on the costs of sending money.” Likewise, the baseline for an irrigation impact evaluation in Ethiopia showed that “female headed-households lag male headedhouseholds with regard to technology adoption, agricultural yields, assets, and income,” and as a result, “the government agreed to pilot strategies for improving women’s access to and take-up of new agricultural technologies.”
Conclusion. Once you’ve finished the PowerPoint presentation of the baseline data, don’t stop. Ask yourself, can these data and results be useful to a larger audience than just the government counterparts I’ve presented them to? If so, write that paper.
I’d love to see other examples of papers that came out of baseline surveys, or of other uses for baseline surveys, in the comments!
Bonus Reading
- David McKenzie has a great, related blog post on getting more than one paper out of a given impact evaluation
- For inspiration: 10 papers based on baseline surveys + 3 that are baseline plus a little extra
- Akresh et al., "Child Ability and Household Human Capital Investment Decisions in Burkina Faso"
- Banerjee et al., "Health, health care, and economic development: Wealth, health, and health services in rural Rajasthan"
- De Martino et al., "Protecting the Environment For Love or Money? The Role of Motivation and Incentives in Shaping Demand for Payments for Environmental Services Programs"
- De Mel et al., "Wage Subsidies for Microenterprises"
- Dhar et al., "Intergenerational transmission of gender attitudes: Evidence from India"
- Diwan et al., "Invitation Choice Structure Has No Impact on Attendance in a Female Business Training Program in Kenya"
- Gibson et al., "How cost elastic are remittances? Estimates from Tongan migrants in New Zealand"
- Jayachandran, "Fertility decline and missing women"
- Kosec et al., "Predictors of Essential Health and Nutrition Service Delivery in Bihar, India: Results From Household and Frontline Worker Surveys"
- Lee et al., "Electrification for "under grid" households in rural Kenya"
- McKenzie and Siegel, "Eliciting illegal migration rates through list randomization"
- McKenzie and Woodruff, "Business Practices in Small Firms in Developing Countries"
- Naudeau et al., "Cognitive development among young children in low-income countries"

Join the Conversation