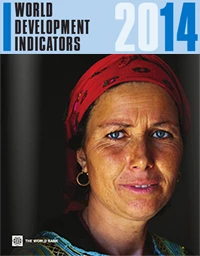
Another publication – the 2014 edition of World Development Indicators (WDI) 2014 – was also released in the last few weeks: it’s not likely to reach the bestseller list on Amazon, but it does also reveal some startling differences in the lives of people around the world, and the challenges they face. Here’s one statistic: a newborn child born in Sierra Leone will be 90 times more likely to die before her fifth birthday than a newborn child born in Luxembourg. And the estimated probabilities of dying before five? In Sierra Leone, in 2012, it was 18%, or just under 1 in 5 – the highest in the world. In Luxembourg, that probability was just 0.2%, or about 1 in 500 – the lowest in the world. Since it really is quite shocking, maybe I should repeat it: almost 1 in 5 children born in Sierra Leone will die before they reach the age of five.
Child mortality rates, 1990-2012
Source: Estimates developed by the UN Inter-agency Group for Child Mortality Estimation (UNICEF, WHO, World Bank, UN DESA Population Division) at childmortality.org.
The second Millennium Development Goal aims to achieve universal primary education around the world: the target is to ensure that by 2015 children everywhere, boys and girls alike, will be able to complete a full course of primary schooling. While the average rate of primary completion for developing countries appears to have stalled somewhat around 90%, and the global goal is unlikely to be met by 2015 at current rates of progress, this chart lets us dig a little dig deeper to look at the differences between girls and boys completion rates, and the difference between countries. We’ve started with Sierra Leone, and added some other countries from Africa for comparison purposes - but again you can pick your own.
Primary School Completion Rates, 2012
Source: UNESCO Institute of Statistics
These are just two examples of data you’ll find in World Development Indicators (WDI). This year’s WDI is its eighteenth edition, and it’s put together by a team in the World Bank’s Development Data Group, who collect the most relevant, reliable, and comparable statistics on development from a wide variety of different sources. Data to monitor each of the Millennium Development Goals are included. And there’s much more than the book – there are online tables , apps for your phone or tablet, a system to interrogate or query the full database, and even a module to use the data in STATA. And, if you want – and many do – you can just download the entire database in one big Excel file!
The WDI contains many more indicators than the two I’ve picked here, and many more insights. Watch out for more short blogs from the team spotlighting the indicators and statistics in WDI, and some of the ways these indicators can help better understand our world. And, we hope, provide useful data in the fight to end extreme poverty.
-------------------------------------------------------
Indicators and codes used in this post:
Mortality rate, under-5 (per 1,000 live births) SH.DYN.MORT
Primary completion rate, total (% of relevant age group) SE.PRM.CMPT.ZS
Primary completion rate, female (% of relevant age group) SE.PRM.CMPT.FE.ZS
Primary completion rate, male (% of relevant age group) SE.PRM.CMPT.MA.ZS


Join the Conversation