This post is part of the Q&A Series with the Data Ambassadors from DataDive2013. You can also read an interview with the poverty data ambassadors, a recap of Data Dive 2013, and watch the presentations from the weekend.
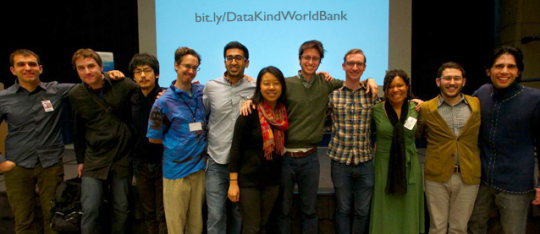
Data Ambassadors posing at the end of DataDive 2013. Photo Credit: Carlos Teodoro Linares Carvalho.
During DataDive 2013, each project had an assigned data ambassador, a leader to guide and direct the research and efforts of the teams. In the days following the DataDive, we spoke with four of the data ambassadors from the poverty projects to learn more about their experiences. Read their responses below and join the conversation in our comments section.
- Monique Williams is an independent consultant and a statistician at the U.S. Government Accountability Office. She led and represented the UNDP Resource Allocation team.
- Nick McClellan is the web production editor for the New America Foundation and he represented the Night Illumination team.
- Max Richman is an independent consultant who provides research and technology services to non-profits, foundations and governments focused on international development. He led the Website Scraping team.
- Tom Levine works in data analysis and he represented the Arabic Tweets project.
What skills were you able to transfer from your past experience to your DataDive project?
MW: The biggest skill I was able to contribute to this group was to help them conceptualize the problem and also to facilitate conversations between the data team and the UNDP staff, so we could really understand one another and translate the language of data. I did some work in preparing the data set and thinking about what kind of analyses would come out of it, and I think that was very helpful to the group. Ultimately, we ended up having to do more data cleaning and bringing in other variables, but just having a vision of what was coming out of it helped people to understand why it was important to make progress on what we were doing.
What were your expectations going into DataDive 2013?
NM: It was my first time as a data ambassador so I didn't really have expectations. The only expectation I came in with was that I knew I wanted to spend more time facilitating, then actively participating. I wanted to open it up to the people who were there, whereas as a participant I would’ve said, “Here’s how I’d like to solve it.” As a data ambassador, I was trying to get ideas from others and tap into their skills to solve these problems.
MW: I was nervous, actually. I did not know what to expect. I asked a lot of questions during our initial meeting. I knew I was going to be late on Friday because I teach a class to elementary school kids. Everyone there was surprised and asked, “You teach little kids? If you can handle that you can definitely handle a data dive.” So I came in with the idea that I can take what I give during my classes, and bring it to the DataDive. It actually worked really well! You just have to allow people to give their best quality of work and to encourage them, because like Jake Porway said, “Sometimes people come without knowing what they can do.” So, whenever someone came without knowing what to offer I would say, “You’re in the right place, so let’s find a place for you,” and that’s how I ended up building my team.
MR: I was completely blown away by the response of the volunteers, as well as the interest of the Bank. Wolfgang Fengler was my Bank contact and client, if you will, and he was thrown into the mix at the last moment. So all of the other teams had spent a couple of weeks preparing and it was the first time that I met him. We quickly sensed each other up and I got a sense of what he was hoping to say and show at the end, which was having a defining chart that he can point to and say, “Look, it’s worth exploring more about how we can get access to this open data to get an early leading indicator, that otherwise we have to wait on formal statistics to take time.” So to be able to identify that pretty crucial need within the first hour of sitting down with him was great. We also had an awesome set of volunteers who jumped in. Some had never done any scraping before; others were professional open data gurus, who quickly hopped on and started pulling in data. By the end of it, we had scraped specifically a number of open sources. We found a defining chart for Indonesia; we also pulled in some really interesting data around Kenya, which we hope Wolfgang and others will be able to use. It was a great coalition effort.
TL: I actually didn’t think we would get anything out of it. Generally social media data and all of that is a big fad. You can get something useful out of it but people make it out to be something bigger than it is. So, I’m actually surprised that we can come up with something.
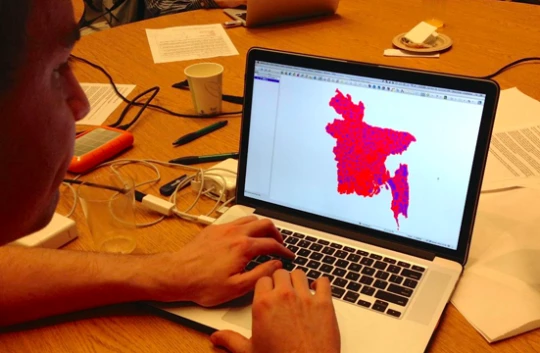
Nick McClellan building a map of Bangladesh using Quantum GIS. Photo credit: Itir Sonuparlak
What drew you to your particular project?
NM: It was the mapping aspect that really drew my attention. We had a weekend before the Dive where we were gathering resources for the project, and I found it really easy to find some really interesting resources to visualize. I thought the Bangladesh Night Illumination Poverty Mapping project was interesting and that we could probably pull out a neat visual.
MW: I chose the UNDP project because a few years ago I wrote a report on the gender pay gap in the government and because of that work I was invited to join another group that was working on the “State of the Federal Government.” They were trying to dig into the components of engagement and leadership, performance and talent that drove the mission-specific performance of all of the federal agencies. Initially, I just came in to show them how to do a regression analysis, but then I was pulled in more and ended up staying with them for over a year. I helped them conceptualize problems, choose different data sets, think about creative ways to match data sets, and talk to the heads of agencies about using their data. We were also able to get a bunch of people together in academia and government to hold a big forum. We talked about how agencies can use their human capital data to improve the quality of life for employees and also to draw on the right talent and match people with the right positions.
MR: I was interested in the Web Scraping project, as well as in the Arabic Tweets project. I’ve been doing a little bit with web scraping and social media network analysis over the last year to two years. That was with a group called Intermedia, a research consultancy, with which I do some consulting. I really like the idea that I only learned web scraping in the last year and as a result of the people who were at the event that taught me how to do it. I like the idea of teaching others and perhaps demonstrate to people at the Bank how we can use these techniques to collect data. So what drew me to it was the ability to learn again every time I do it just to remind myself on the technical side. Explaining it to others who have never done it before is a really good practical exercise to making sure I really understand it.
TL: It wasn’t until the very end of our preparation that we chose on which project we were going to be working. I didn’t have much preference, because they all seemed great. So, I first let some other people choose. At the end for me, it came down to either the Arabic tweets project or the scraping websites for rice prices project. It seemed like Max R. would be a better fit for the scraping websites project. I’m probably better at scraping websites, but we also got a large twitter data set and I wanted to get that and put it into some database system so that we could easily access it.
What kind of data challenges did you face throughout the weekend?
NM: Finding resources for data was an issue. At first look, we found 2012 night light data. We also started with 2005 and 2001 poverty and Census data. It just wasn’t appropriate to take night light images from 2012 and make calculations based on 2005 poverty data. So we had to find proper resources from the appropriate year. We also had to convert the data into another format in order to visualize them, which grew the file size. At one point during the Dive I remember someone yelling, “Someone has to take their 6GB file out of the shared Dropbox!” I thought “Oops, sorry! It was me!” I didn’t even realize the file size had gotten so big. Looking at visual correlations would be an interesting next step. So for example, getting data on slum locations and seeing if it correlates to the lack of light.
MR: It would’ve been really good to identify offical data sources. We got some idea from the World Bank folks who were joining us and providing us with some resources. It was great, actually, because it was a research exercise, but maybe that could’ve been something that we prepared. The second one was, what are the open sources that we can identify. Our group excelled in identifying sources that I would’ve never thought of, like the wayback machine to look at older versions of supermarket websites. Those are some really creative things that the group came up with that I wouldn’t have necessarily thought of. As for technical challenges, number one was grabbing the data. So, teaching people how to scrape and trouble shooting with scrapers.
TL: The main challenge was that many of our teammates weren’t comfortable doing statistics or quantitative analysis. And another one was that, we couldn’t actually run anything on the full dataset. If we had prepared it even better than I had, it would’ve been feasible, but we could only work on the sample. That limited what we can do.
Which skill did you think was the most necessary during an event like this?
NM: Everyone has a broader set of skills, but I think communication is a big one. Just knowing how to talk to someone and communicate is really key. This doesn't have anything to do with your skills as a developer. Being able to code is an excellent skill too, obviously, but those skills are usually more pertinent depending on the project. Being a great communicator is a good skill in general.
MR: For the project that I was working on, clever research skills and being able to find some unique sources of data, the first and foremost a skill that everyone possessed walking in the door. We needed a lot of that. Second thing was having some ability to write code to build a web scraper and we were mainly writing them in Python, and Python is a pretty high-level programming language. In general, people that are kind of lateral. I think of myself as, I do GIS and mapping, but not like a super geo-spatial statistician. I know a little bit about statistics and survey research, but I’m not a complete statistic expert. So people who are across a few things, the main buckets being design, and communication of data, the second one being statistics and numbers, and understanding how to interpret them and the third is the technology: the coding and the programming. So people that fit into any of those three boxes are extremely useful and people that can cross all of them at a superficial level, like I try to do, I think can be very plugged into many different projects that are happening at these kinds of events.
What would you recommend for those who want to get involved in similar events?
NM: It's funny becuase the way I got involved was almost forced. My organization was hosting the event, but I was surprised that it turned out to be so fulfilling. Try to find a similar opportunity in your city, like an open data day or a hackathon. Just poke your head in and talk to some people and see if there’s anything that piques your interest. You’ll be surprised. You could come across a team that is working on a project, which could benefit from your skills. It’s a great feeling to know that your skills are what is needed to get a project over the finish line.
MR: I’ve been a big fan of DataKind for a long time. In terms of having weekend events, what it forces you to do is meet people. I’ve met people at these events with whom I subsequently hacked with independently and at different hackathons and events. Another way is there are a lot of great meet-ups in DC in particular but in other places. DC has the great Data Community DC, led by Harlan and others. That’s a great way to meet people. I really like the GeoDC meet-up as well. That’s a great place to meet people interested in design, data and technology. There are communities of people who do work around international development in DC, that’s the big thing of course. So between hackathons and meet-ups, there are lots of ways to meet people. And also the weekend events can be a great way to flex your skills. Third thing is to just jump into it and start doing it on your spare time. If it’s a hobby and you can’t work it into your business process at work, then find some way to keep it fun and small at home. That’s what I have been doing. I’ve been teaching myself how to build a web application, which is very simple, but hoping to be able to launch shortly. It basically uses some open data API’s, including the World Bank’s data API. Mostly, copying other people’s much more impressive bits of code and changing it just a little bit so that it fits with my data. That’s the basic idea.

Join the Conversation