The Central Statistical Agency (CSA) in collaboration with the World Bank’s Living Standards Measurement Study (LSMS) team launched the third wave (2015–16) of the Ethiopia Socioeconomic Survey (ESS) panel data, on February 22, 2017.
The ESS is a nationally representative survey administered every 2 years that covers a range of topics including demography, education, health, savings, labor, welfare, and agriculture, food security and shocks. The data is collected in two visits: post-planting and post-harvest seasons. The survey follows the same households over time and collects a rich set of information, to allow for comprehensive panel data analyses that can help shape policies for a wide array of development sectors.
Here are some interesting findings from the ESS 2015–16 survey:
- Education: self-reported literacy (for reading and writing in any language) is 59% for males and 43% for females.
- Access to mobile phone: approximately 54% of Ethiopian households have at least one member with a mobile phone. By place of residence, access is 43% in rural areas, 76% in small towns and 89% in medium and large towns.
- Non-farm enterprises: approximately 25% of Ethiopian households own and operate a non-farm activity.
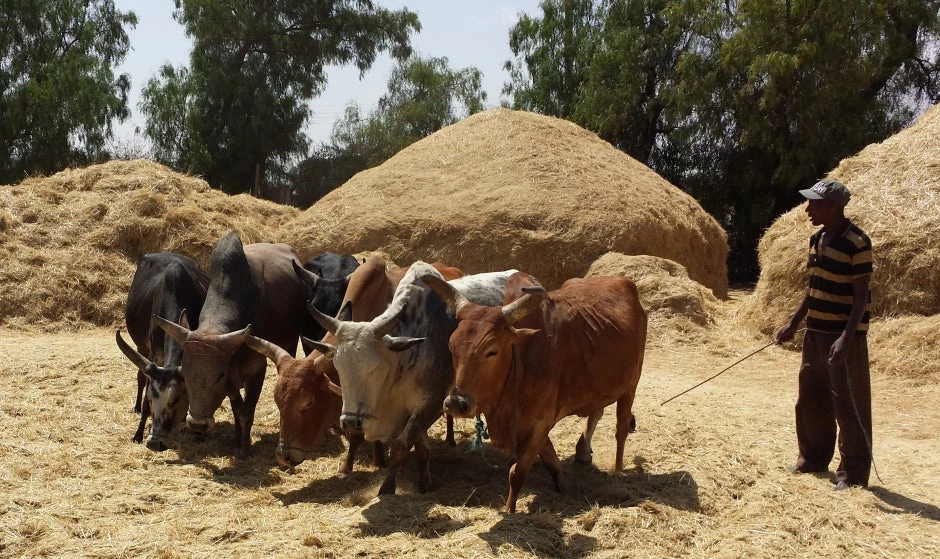
- Agriculture: at the national level, farming households cultivate 11 fields on average with an average field size of 0.13 hectares.
- Food security: food availability is seasonal. Major planting seasons-April to October-are major slack months. Rural households tend to be the most affected by seasonal food shortage.
- Shocks: main shocks in the last 12 months include illness of household member (23% of households), followed by drought (21%), increase in the price of food items (21%) and increasing price for inputs (14%).
- Financial inclusion: approximately 22% of adults (18 years and older) have accounts from formal financial institutions. At the household level, financial inclusion is higher (35%).
Data from all three waves has been made freely available to encourage policy makers, researchers and development partners to monitor living standards and formulate policies.
To access the dataset, and documentation on the survey process and results, visit the Microdata Catalog: http://microdata.worldbank.org/index.php/catalog/2783/study-description
The survey is the result of a partnership between the CSA, the Bill and Melinda Gates Foundation (BMGF) and the World Bank.


Join the Conversation