Facebook recently announced the public release of unprecedentedly high-resolution population maps for Ghana, Haiti, Malawi, South Africa, and Sri Lanka. These maps have been produced jointly by the Facebook Connectivity Lab and the Center for International Earth Science Information Network (CIESIN), and provide data on the distribution of human populations at 30-meter spatial resolution. Facebook conducted this research to inform the development of wireless communication technologies and platforms to bring Internet to the globally unconnected as part of the internet.org initiative.
Figure 1 conveys the spatial resolution of the Facebook dataset, unmatched in its ability to identify settlements. We are looking at approximately a 1 km2 area covering a rural village in Malawi. Previous efforts to map population would have represented this area with only a single grid cell (LandScan), or 100 cells (WorldPop), but Facebook has achieved the highest level of spatial refinement yet, with 900 cells. The blue areas identify the populated pixels in Facebook’s impressive map of the Warm Heart of Africa.

Facebook’s computer vision approach is a very fast method to produce spatially-explicit country-wide population estimates. Using their method, Facebook successfully generated at-scale, high-resolution insights on the distribution of buildings, unmatched by any other remote sensing effort to date. These maps demonstrate the value of artificial intelligence for filling data gaps and creating new datasets, and they could provide a promising complement to household surveys and censuses.
Beginning in March 2016, we started collaborating with Facebook to assess the precision of the maps and explore their potential uses in development efforts. Here, we describe the analyses undertaken to date by the Living Standards Measurement Study (LSMS) team at the World Bank to compare the high-resolution population projections against the ground truth data. Among the countries that were part of the initial release, Malawi was of particular interest for the validation exercise given the range of data at our disposal.
Validation in Malawi
In constructing the high-resolution population map for any country, the starting point is CIESIN’s Gridded Population of the World, Version 4 (GPWv4). Of particular importance is the population and housing census based input data used by CIESIN to produce GPWv4, and specifically the spatial resolution of the underlying input data, which varies widely depending on the country. In Malawi, the GPWv4 estimates are already produced based on the 2008 PHC-based EA-level population counts (really, the best case scenario), thanks to the Malawi NSO sharing these data with CIESIN.
In our current analysis, we used household locations from the Third Integrated Household Survey (IHS3) to assess Facebook’s population map. The IHS3 data are representative at the national-, regional-, and district-level, and the survey was conducted by the Malawi National Statistical Office (NSO) with financial and technical support from the World Bank LSMS – Integrated Surveys on Agriculture (LSMS-ISA) program. The sample includes 12,271 households, distributed over 768 EAs in 31 districts that were visited during the period of March 2010-March 2011.
The LSMS team overlaid the IHS3 household locations on the Facebook population map to compute the incidence of a Malawian household appearing in a pixel with no population according to Facebook’s map. We worked with the confidential georeferenced household locations that are not publicly available, given the confidentiality agreements with the IHS3 respondents. Respecting people’s privacy is paramount to all organizations involved in this effort. The Malawi NSO has provided clearance for our research, and the LSMS and the Malawi NSO are the sole gatekeepers of these confidential data that are not shared with anyone else inside or outside the World Bank. At no point were the data shared with partner organizations, and only aggregated, anonymized results were reported.
Generally, we found only minimal discrepancies between the Facebook population dataset and the household survey data. Indeed, at the national-level, the incidence of finding Malawian households at a distance of more than 100m from the nearest populated pixel was only 6.3 percent. We use a 100m tolerance in view of the (i) possible limitations in accuracy of GPS position, (ii) GPS measurements having been taken outside of the structures, and (iii) imprecision introduced by the gridding process itself. The incidence of a Malawian household appearing in a pixel with no population according to Facebook’s map is near non-existent if one defines positive household identification as being within 500 meters of a populated pixel.
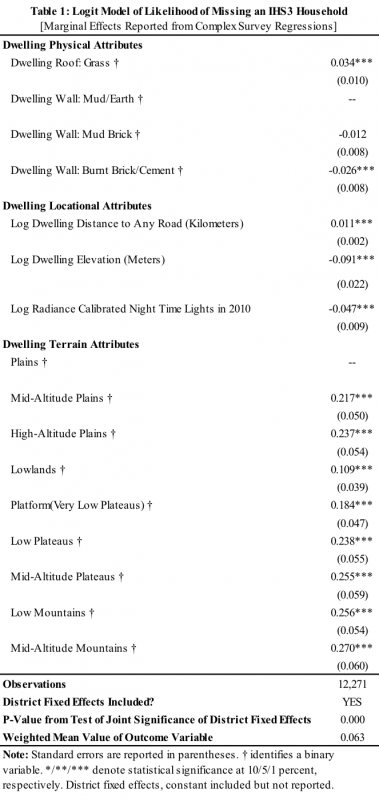
To better understand the profiles of the “missed” IHS3 households, we first reviewed each missed location manually in Google Earth, and observed that these households were often 1) frequently occurring in clusters of three or more, and 2) more remote and with smaller structures compared to the rest of the sampled EA. The former may be linked to the mismatch between the dates of the imagery and the dates of the IHS3 fieldwork. To systematically map out these factors, we estimated a simple logit regression that models the likelihood of missing an IHS3 household as a function of dwelling physical, locational and terrain attributes. As this is on-going work, the findings should be treated as preliminary. The results from the logit regression are reported in Table 1, and confirm the qualitative observations emerging from the review of the Google Earth imagery.
Smaller, more traditional and more remote dwelling units are associated with a higher likelihood of being missed. Night time lights at dwelling location in part capture the urban/rural dimension of the population mapping exercise, and are negatively correlated with being missed. The Facebook algorithm is believed to perform better at identifying structures at higher elevation levels and in plains, and this notion is confirmed in the analysis of the IHS3 data. However, Facebook’s ability to identify structures is expected to be constrained at times by satellite imagery with clouds, which we are currently investigating.
As we advance the cross-country validation program, we will explore the feasibility of predicting population estimates at high-resolution, as a function of not only estimated building footprint but also other geospatial data that could be generated independent of census data. Pursuing this line of work will not be easy nor guaranteed success, but this task appears critical for assessing the relevance of these outputs for sampling in household surveys, as detailed below.
Looking Forward
Accurate, precise population data has a variety of applications for humanitarian actors. Several World Bank specialists are considering the use of the Facebook population maps for specific projects in infrastructure planning and impact assessment, and in disaster relief activity planning and scenario analysis.
Since the maps are public goods with direct relevance for the global household survey data agenda, the Living Standards Measurement Study (LSMS) has a stake in documenting their precision and maximizing their country-relevance. We hope to advance this work in collaboration with partners at Facebook and CIESIN, and are in discussions with other NSOs bring more countries into the validation work program.
Our medium-term goal is to formulate methodological guidelines for using these maps, alongside other sources of geospatial and Big Data, for sampling in household surveys, particularly when a census-based sampling frame is non-existent/incomplete and/or outdated. These guidelines are proposed to feed into the World Bank methodological research agenda for household surveys that is currently under discussion, and will be an immediate contribution to the global household survey agenda.


Join the Conversation