The World Development Indicators (WDI) is the World Bank’s premier compilation of international statistics on global development. Drawing from officially recognized sources and including national, regional, and global estimates, the WDI provides access to almost 1,600 indicators for 217 economies, with some time series extending back more than 50 years. The database helps users—analysts, policymakers, academics, and all those curious about the state of the world—to find information related to all aspects of development, both current and historical.
An annual World Development Indicators report was available in print or PDF format until last year. This year, we introduce the World Development Indicators website: a new discovery tool and storytelling platform for our data which takes users behind the scenes with information about data coverage, curation, and methodologies. The goal is to provide a useful, easily accessible guide to the database and make it easy for users to discover what type of indicators are available, how they’re collected, and how they can be visualized to analyze development trends.
So, what can you do on the new World Development Indicators website?
1. Explore available indicators by theme
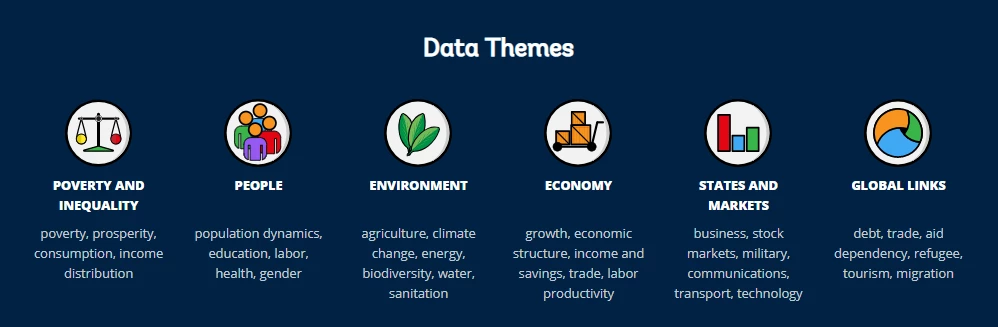
The indicators in the WDI are organized according to six thematic areas: Poverty and Inequality, People, Environment, Economy, States and Markets, and Global Links. Each thematic page provides an overview of the type of data available, a list of featured indicators, and information about widely used methodologies and current data challenges.
2. See a snapshot of data availability over time and across the world
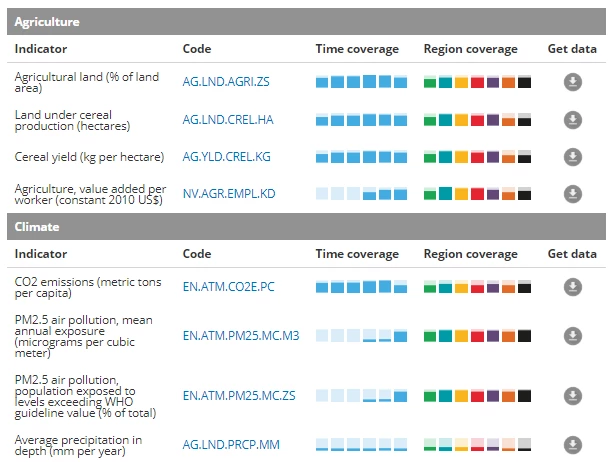
Each thematic page shows a list of featured indicators where you can easily see data time coverage per year for each decade since the 1960s, as well as the regional coverage for each World Bank geographical region since 2010.
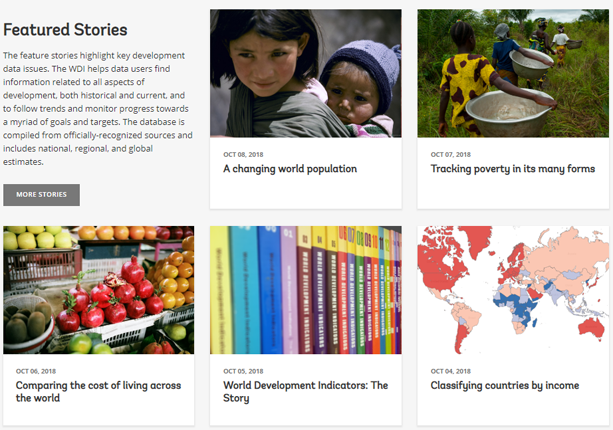
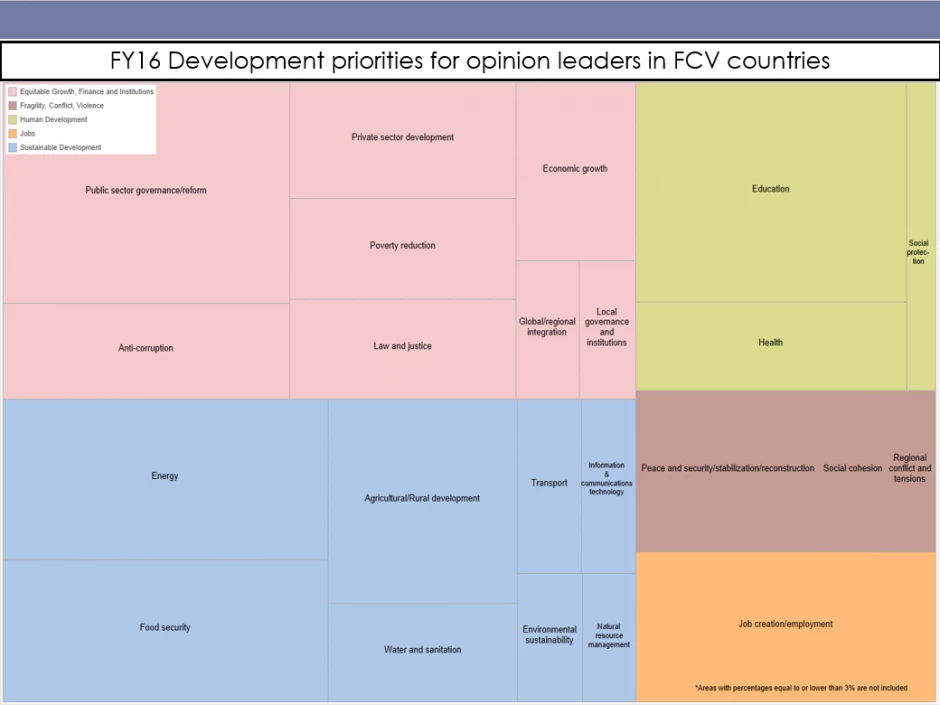
3. Discover stories
|
|
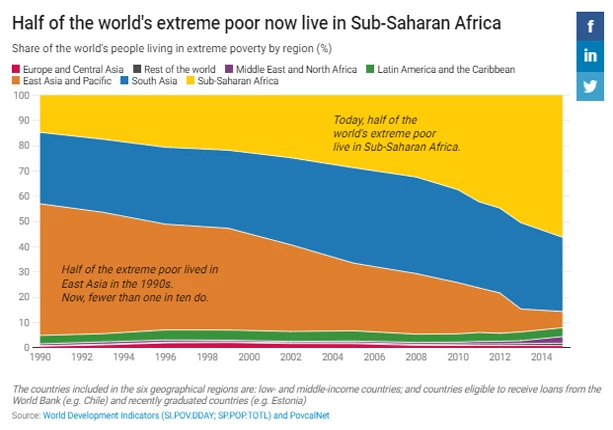
Throughout the website, we’ve illustrated how WDI indicators can be used to explore development trends and current data issues through stories and shareable visualizations. Our stories look at issues such as tracking where the world’s poorest people live today, changing trends in population growth, or whether children who work attend school.
4. Access Data
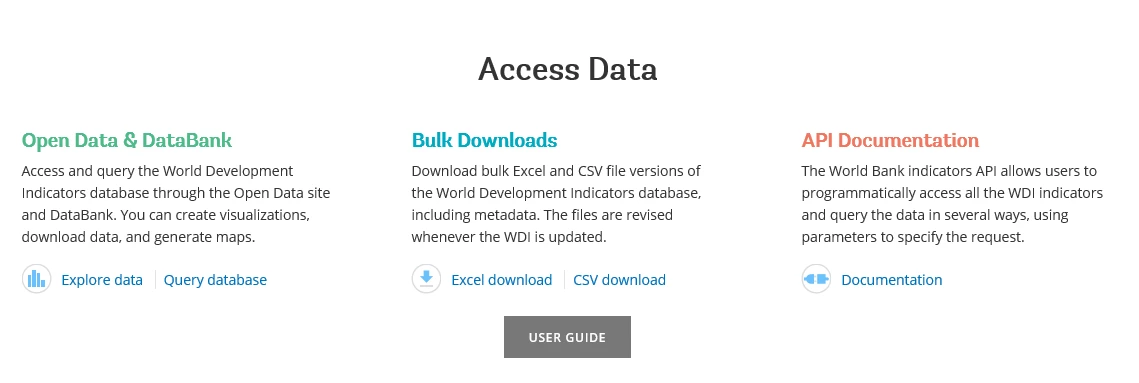
For quick access to the time series data the website offers direct links to the Open Data site and DataBank, an interactive tool for data analysis and visualization. Users can also easily download bulk versions of the database in Excel and CSV, and access information about the World Bank data API.
5. Check out the special features
Users can understand the World Bank’s analytical groupings of countries, and easily visualize the change in the World Bank country classification over the years using an interactive map . . .
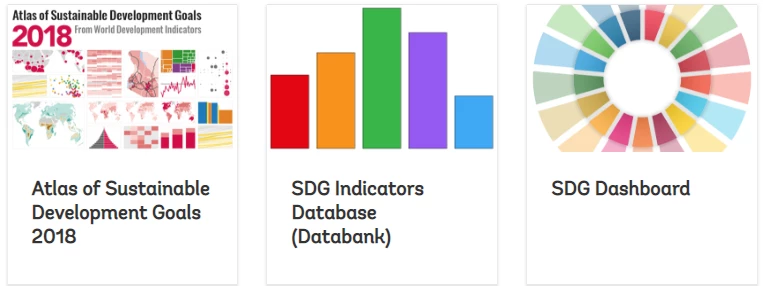
… or learn about the role of the World Bank in the monitoring of the Sustainable Development Goals.
6. Make use of a wealth of resources
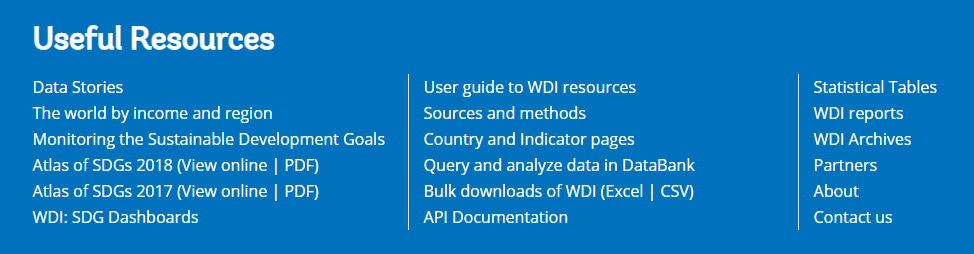
The new WDI website allows users to quickly access relevant data and materials including information about sources and methodologies, the WDI statistical tables, or the WDI archives.
The World Development Indicators is made possible by the efforts of statisticians and data scientists everywhere. The database is produced and curated by the Development Data Group, in collaboration with more than 200 national statistical offices, over 50 external partners, as well as the Bank's experts in country offices and its Global Practices.
For questions or feedback related to the WDI, contact data@worldbank.org.

Join the Conversation