
Improving the capacity of national statistical systems (NSSs) has long been a part of the global development agenda. The NSSs play an important role in modern economies. They provide stakeholders, ranging from policy makers to stock market analysts and the general public, with the data on the country’s socioeconomic developments. At the international level, monitoring global initiatives such as the Sustainable Development Goals (SDGs) requires high-quality data that are produced consistently across different national statistical systems.
In 2004, the World Bank developed the Statistical Capacity Index (SCI) to measure progress in statistical capacity building. The SCI was based on publicly available data and was designed to assess a country’s statistical capacity in an internationally comparable and cost-effective manner. Several international and national agencies have adopted the SCI for measuring progress in statistical capacity building and related investments (United Nations, 2016).
Globalization of the world economy demands higher standardization and integration of various data sources. New, previously unavailable types of data (e.g. detailed trade and custom information, individual level financial transactions, detailed call records), wide access to GIS and administrative data, and advances in IT and communication technologies have revolutionized the ways data are collected, compile and disseminated. The challenges faced by NSSs and the environment they operate in have evolved over the last 15 years. It is apparent that the SCI needs to be revised to better reflect the new requirements on NSSs.
A recent paper by Cameron et al. (2019) is one of the first attempts to develop the conceptual foundation for statistical capacity indexes and construct a new index to measure the ability of NSS to produce high-quality data to inform national and international policy decisions. More generally, the paper also aims at measuring a country’s bureaucratic capacity. Here, the capacity could be measured directly through assessments or surveys (for example US Census Bureau TASC), or indirectly through proxy measures.
The concept behind the SPI views the statistical capacity of an NSS in terms of its range of products, and the processes the NSS uses to generate and disseminate them. This approach identifies five dimensions for a measure of statistical capacity:
- Methodology, Standards and Classifications, which provides information on the technology being used by the NSS
- Census and Surveys, which describes the intermediate products of the NSS
- Availability of Key Indicators, which focuses on key final products needed for policy
- Dissemination Practices and Openness, which evaluates the extent to which products are publicly disseminated
- Flexibility, which assesses ability of an NSS to adapt to changing circumstances
The new Statistical Performance Index (SPI) is designed to satisfy seven criteria. The SPI should be:
- Simple. It must be understandable and easy to describe.
- Coherent. It must conform to a common-sense notion of what is being measured.
- Motivated. It must fit the purpose for which it is being developed.
- Rigorous. It must be technically solid.
- Implementable. It must be operationally viable.
- Replicable. It must be easily replicable.
- Incentive Compatible. It must respect country incentives.
The SPI must also satisfy three axioms. The symmetry axiom requires that the index value is unaffected when variable levels are switched. The dominance axiom requires that the index value rises whenever one variable rises from 0 to 1 and the rest of the variables do not fall in value. The subgroup decomposability axiom allows the index to be divided into salient sub-indices and linked back to the original index for policy analysis.
Taken together, the criteria and axioms provide a theoretical framework that guides indicator selection and informs how indicators are aggregated into a summary measure. The resulting index (SPI) improves over the existing SCI index by including richer and more comprehensive dimensions; more indicators: the SPI has 42 indicators, versus 25 indicators in the SCIs; covers more countries: the SPI covers more than 200 countries, especially including high-income countries, while the SCI covers fewer than 150 countries and does not include high-income countries.
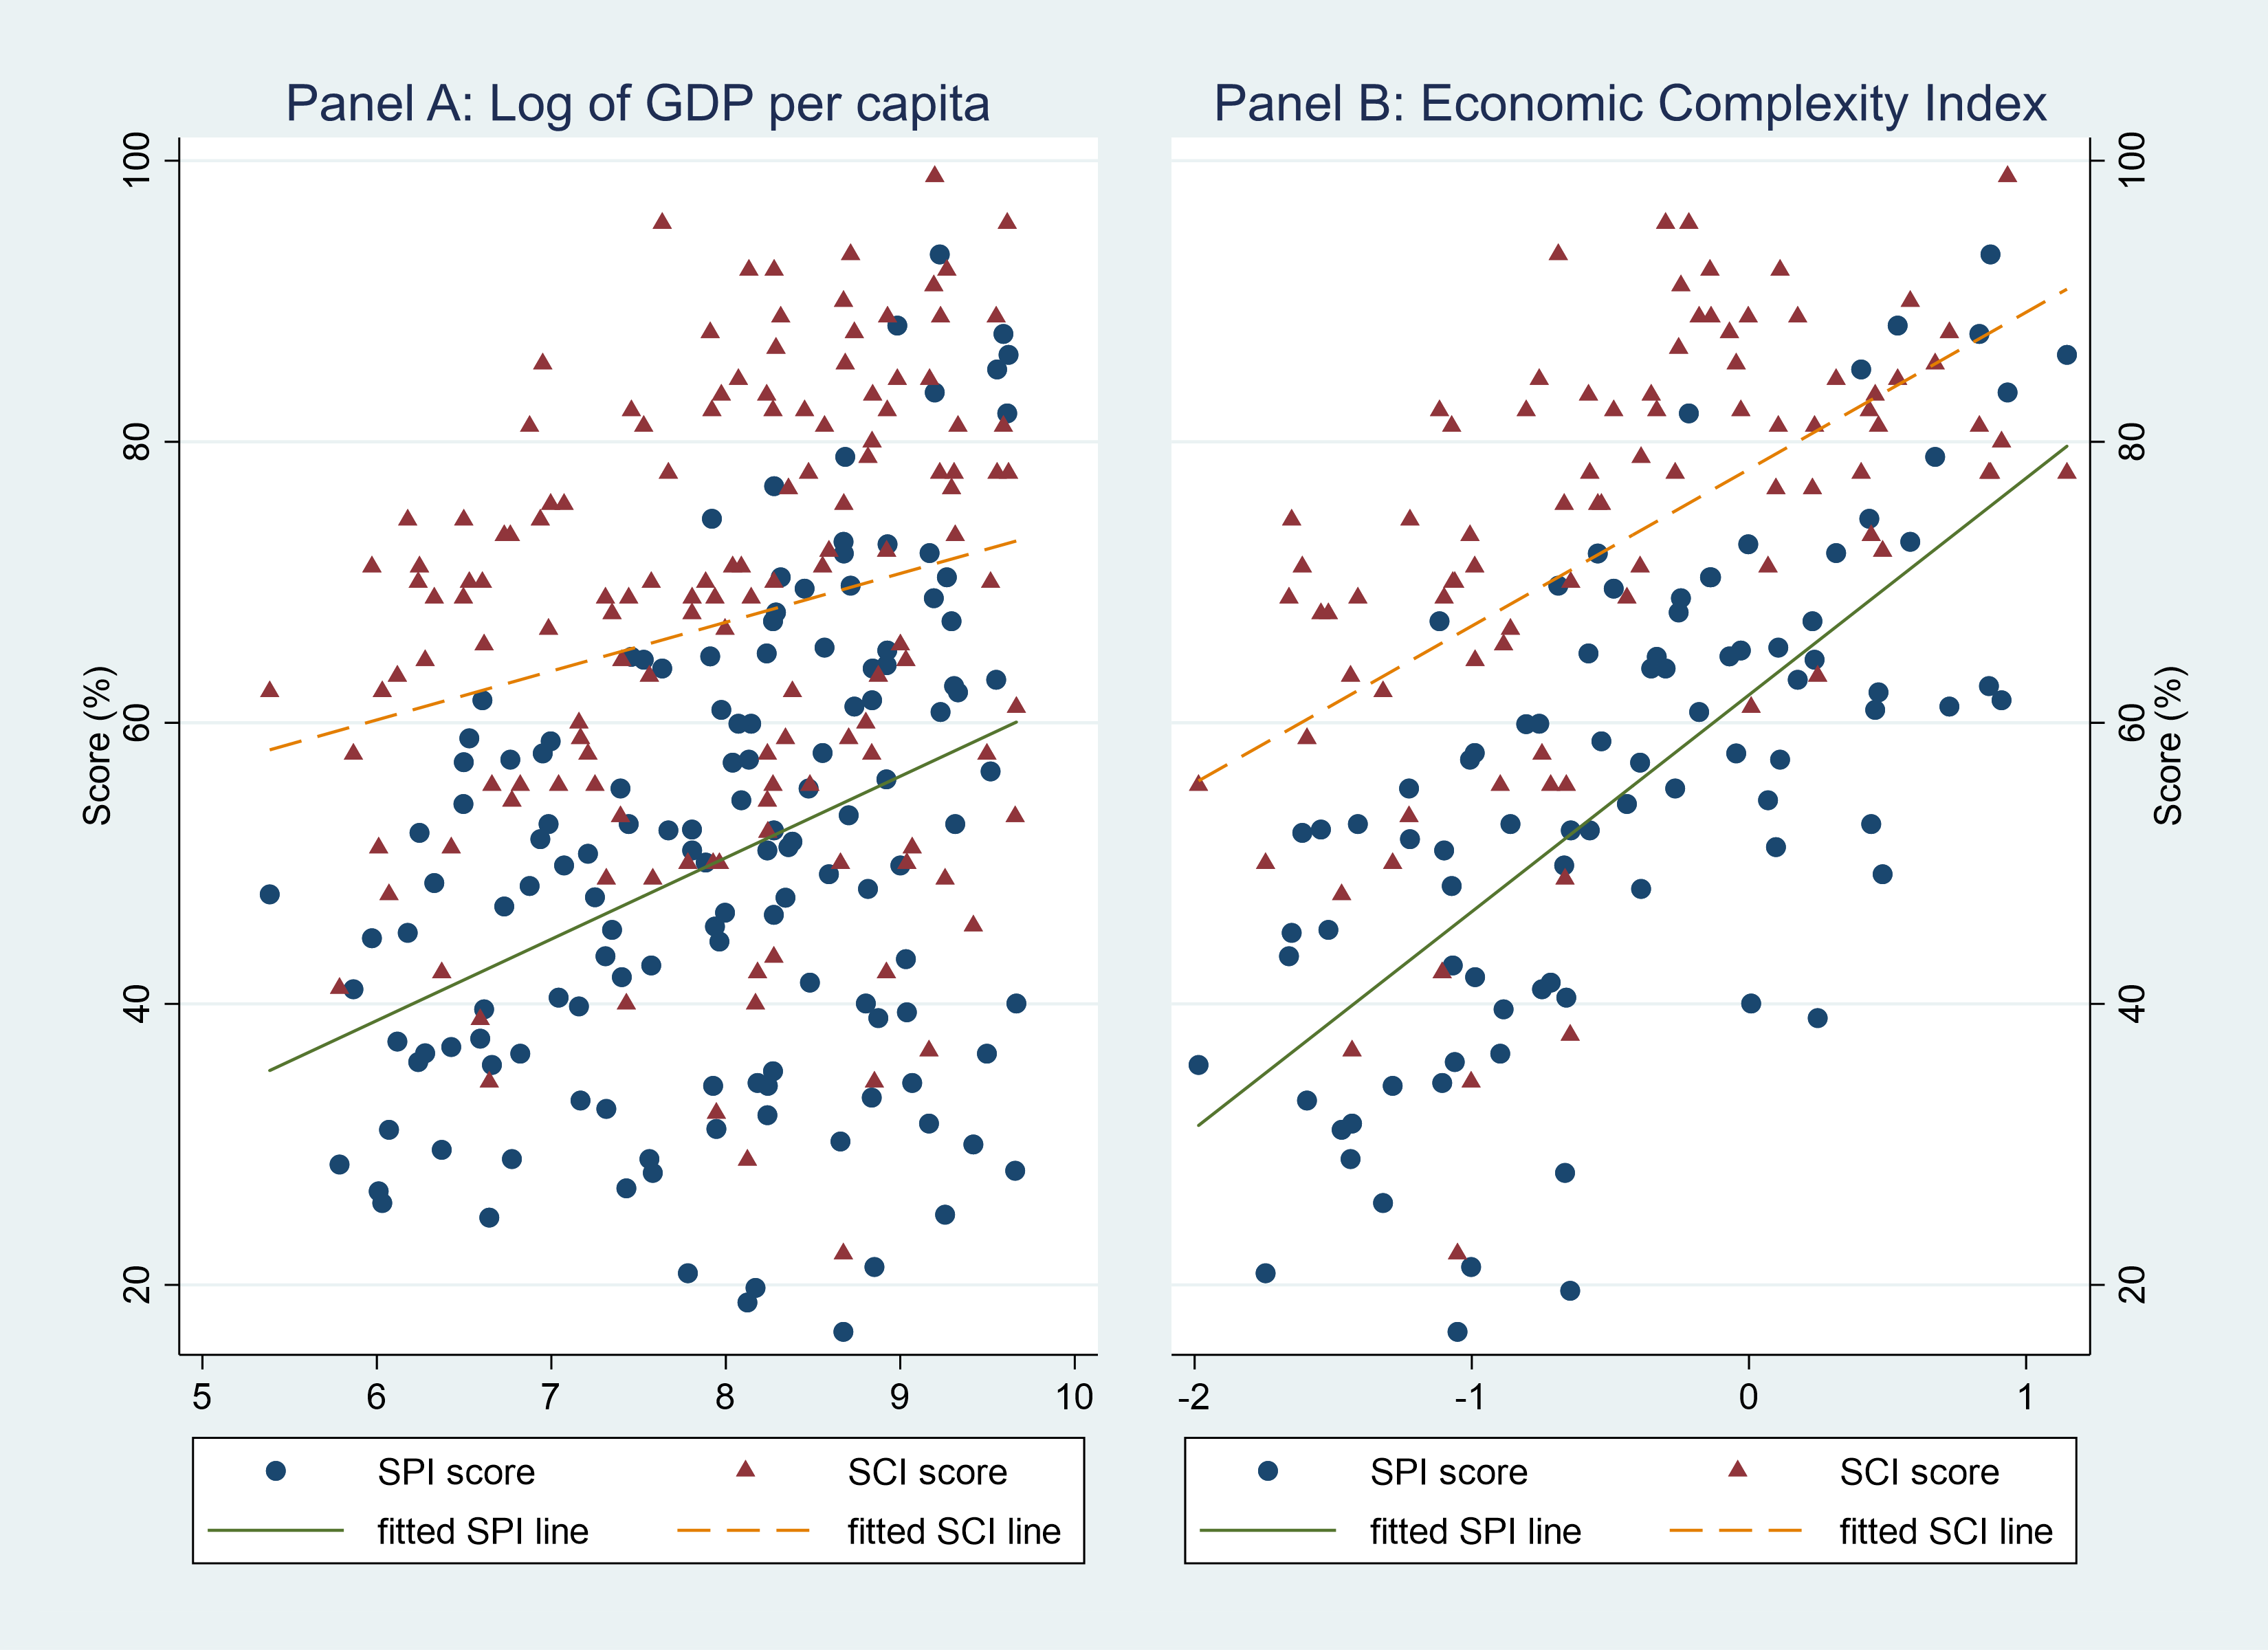
Figure 1 plots the SPI and SCI country scores against log of GDP per capita (Panel A) and economic complexity index (Panel B) for the 146 countries covered by both indexes for 2016. Both plots illustrate the stronger relation of SPI with per capita GDP and the Index of Economic Complexity. Indeed, we would expect statistical capacity to be higher for richer countries and for the countries with more complex economies.
The framework developed in the paper is flexible enough to allow for future revisions as the global data landscape evolves. For example, we can consistently incorporate new indicators such as whether an NSO uses cloud computing to store their data or implements household panel surveys in the relevant dimensions. Our methodology may also be relevant to the construction of other indexes in related areas, such as tracking the global SDGs or child development.
Laying out the theoretical foundation for SPI could be seen as the first step before more resource-intensive country-specific assessments to inform multi-year improvement plans. That work will involve expansion of the available time series data both for the recent years and for the several years past to allow the index comparability analysis. We plan to publish the second paper later this year.


Join the Conversation