
What's new about this?
The common data source of population estimates for most countries is a census, often conducted every 10 years or so. Many countries publish annual estimates between census years, but few publish similar population estimates for subnational regions. This database aims to provide intercensal estimates using a standard methodology.
How did we construct the estimates?
We used two sources: estimates published by National Statistical Offices worldwide and subnational population data from the Center for International Earth Science Information Network (CIESIN) of the Earth Institute at Columbia University. The Center for International Earth Science Information Network (CIESIN) of the Earth Institute at Columbia University, in collaboration with national statistical offices and other data providers worldwide, makes available a global gridded population database derived from the highest-resolution subnational population data available. Known as the Gridded Population of the World (GPW), CIESIN produces the data under the auspices of the Socioeconomic Data and Applications Center (SEDAC).
We've adjusted the estimates from these sources to represent the mid-year point (July 1), interpolating or extrapolating the data as needed.
For the interpolated data, we used the constant rate of change between two available adjacent data points which overlaps mid-year point(s). For the extrapolated data, we used the same rate of change as the average of the earliest (or latest) 3 years the population shares for each first-level administrative division and applied these to the annual total population estimates in the World Development Indicators to calculate estimates or population numbers for subnational regions.
Click here to view our Frequently Asked Questions.
To help standardize first-level administrative units for individual countries, we've harmonized names and codes from census counts and national estimates with the Food and Agriculture Organization of the United Nations FAO's Global Administrative Unit Layers (GAUL) database.
What can we see from these estimates?
We hope this will be a useful dataset to understand the geographical distribution of populations within countries and see how these population figures have changed over time. One case: according to the UN Population Division, more than half of the world's population lives in urban areas and virtually every country is becoming increasingly urbanized. The new dataset helps us see these trends. For example:
- Brazil's population increased from 176 million in 2000 to 206 million in 2014. The population is highly concentrated in the state of São Paulo, one of the most populous subdivisions in the region, accounting for 22% of Brazil's total population. The population of São Paulo increased from 38.3 million to 44.4 million between 2000 and 2014.
- Bangladesh's population grew from 131 million in 2000 to 159 million in 2014. Dhaka division's population, which represents about one-third of the total population, increased from 41.1 million in 2000 to 53.2 million in 2014.
- Angola's population increased from 15 million in 2000 to 24 million in 2014. The largest proportion of the total population (27%) is concentrated in Luanda, the smallest region of Angola, and its population increased from 4 million in 2000 to about 6.5 million in 2014.
Challenges and limitations
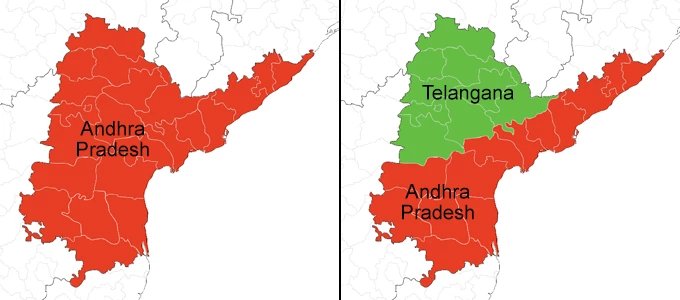
In constructing this dataset, one of the biggest challenges we faced is managing the changing subnational boundaries. This makes it very difficult to produce consistent and comparable estimates over time. We have also used the boundary framework available from the most recent censuses or published population estimates from the statistical offices of each country. As a result, some subnational population estimates might not reflect the current first level administrative unit framework. An example is the Indian state of Telangana, which was formed in 2014 and used to be a part of the Andhra Pradesh state. In this case, the latest dataset we've used was the 2011 census count, which show Andhra Pradesh's subnational population data before it was split into Andhra Pradesh and Telangana states.
We hope that this pilot database will be of good use, but we acknowledge that it is still a work-in-progress. We'll continue to incorporate more and better data as they become available and improve the methodology. Please explore the subnational population database in our DataBank application.
Disclaimer: Country borders or names do not necessarily reflect the World Bank Group's official position. This map is for illustrative purposes and does not imply the expression of any opinion on the part of the World Bank Group, concerning the legal status of any country or territory or concerning the delimitation of frontiers or boundaries.


Join the Conversation