| Figure 1. Risks to Global Growth Upside risks to global growth have increased since January while downside risks for current-year growth have reached post-crisis highs. |
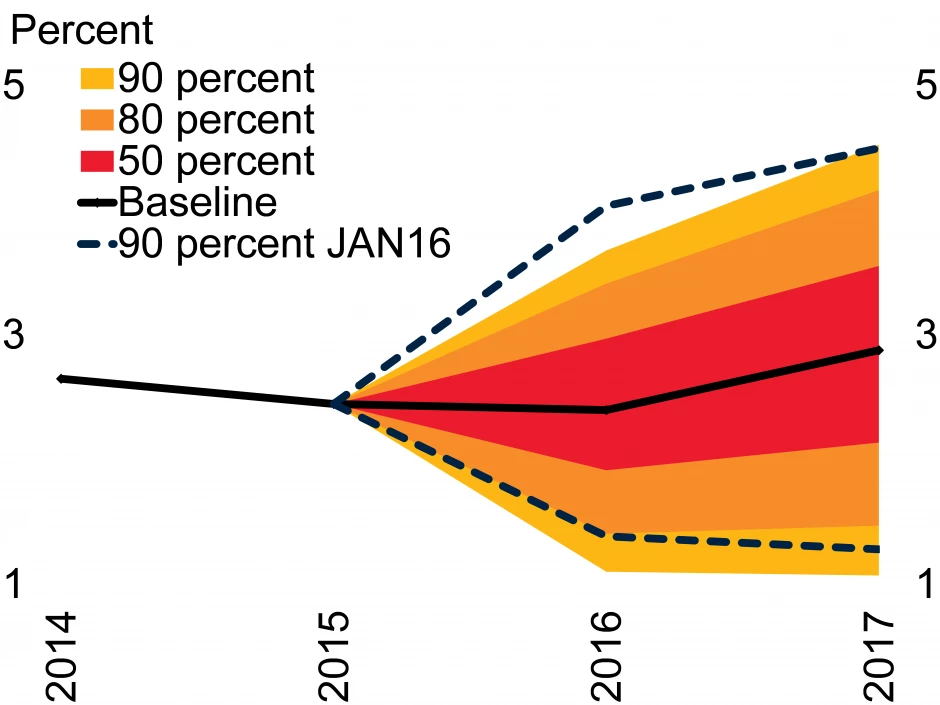 |
| A 90% confidence interval implies a 90% chance of growth falling within the given range |
Assessing economic forecast uncertainty and the balance of risks to the growth outlook is critical to effective policymaking. Lower-probability but high-impact events can lead to significant deviations from baseline projections, and this should be factored into policy design. The World Bank’s most recent Global Economic Prospects unveiled a tool to quantify uncertainty around global growth forecasts and presented it in the form of a fan charts (Figure 1)
The approach adopted in the Global Economic Prospects report consists of two steps.
First, a number of measurable risk indicators that are typical sources of forecast errors for global growth forecasts are selected. Three were chosen: equity price futures, oil price futures and bond term spreads (the difference between short and long term interest rates). For instance, greater volatility in oil price futures could be associated with rising uncertainty around global growth forecasts, while a downward trend in equity price futures could signal rising downside risks to growth.
Second, the probability distributions of forecasts for these three indicators are then mapped to the distribution of global growth forecasts. Both the degree of uncertainty and the balance of risks to the forecast are approximated by weighted averages of the standard deviation and skewness implied by the distributions of expectations for the risk indicators. The weights are estimated in a vector autoregression model (Ohnsorge, Some, and Stocker 2016). To account for potential asymmetry in the distributions of risks, a two-piece normal distribution is assumed, in line with other studies.
The resulting fan chart shows confidence intervals at 50, 80 and 90 percent probability around the growth projections presented in the June 2016 GEP.
Using information available up to May 2016, uncertainty surrounding global growth forecasts had risen throughout the first half of the year to levels slightly above the long-term average. This reflected heightened volatility in oil prices, term spreads and equity prices since the start of 2016.
The balance of risks was also tilting increasingly to the downside for 2016. Rising downside risks and diminishing upside risks compared to January forecasts largely reflected falling equity price futures, suggesting growing concerns about economic prospects.
Overall, the probability of global growth being 1 percentage point lower than currently projected in 2016 remained around the average for the decade (12.5 percent), still well below the probability in 2008 on the eve of the global financial crisis (18 percent).


Join the Conversation