So. You're looking for the World Bank's data. Here are the top 5 ways I access it, what are yours?
1) data.worldbank.org
Our most popular open data destination - the main World Bank Data site gives you an overview of the data we have on a country, region or topic. I like it because you can quickly browse and filter through many years of indicator data, make some basic charts and even embed them into your own web page.
In the past, most of the data on this site came from the World Development Indicators (WDI) but now, if you look at the country pages, you'll see we've started to integrate open data from other World Bank databases.
For example, on this page for Bangladesh you can see development indicators from the WDI, a map with details for our projects and operations in the country, a summary of our lending activities, details of the surveys we have covering Bangladesh and data on climate change.
Watch out for a blog post soon from Tim explaining the technical details of how this all works - we'll be applying the same approach to other parts of the site.
2) The DataBank Tool
DataBank is the most awesome World Bank data tool you've probably never heard of. It's an analysis and visualization platform that contains collections of time series data from a variety of sources, including the WDI.
You can create your own advanced queries, generate tables, charts and maps and easily save, embed, share and download them. There's a video tutorial and some FAQs here, but the best thing to do is just have a play - there's a chart I made below and you can see other charts and reports users have shared.
Annual GDP Growth %
Also: we're launching the French, Spanish, Arabic and Chinese versions of this in the next few weeks - stay tuned!
3) The Data Finder Mobile Apps
I'm a huge nerd and still surprised how often I'm away from a computer (read: triva night) with a sudden thirst for data. Mobile apps are great for this and we produce Data Finder for the iPhone, iPad, Android phones & tablets and Blackberry devices too.
All the content is available in English, French, Spanish and Chinese so you can tell the 3.5 billion people that collectively understand those languages to download them now!
The best bit for me is that these apps mostly work offline, so if you don't have a data plan, are on a low-bandwidth internet connection, or are truly "off grid" you can still easily find out that GDP growth for Bangladesh in 2010 was a hearty 6.1%.
4) The Developer APIs
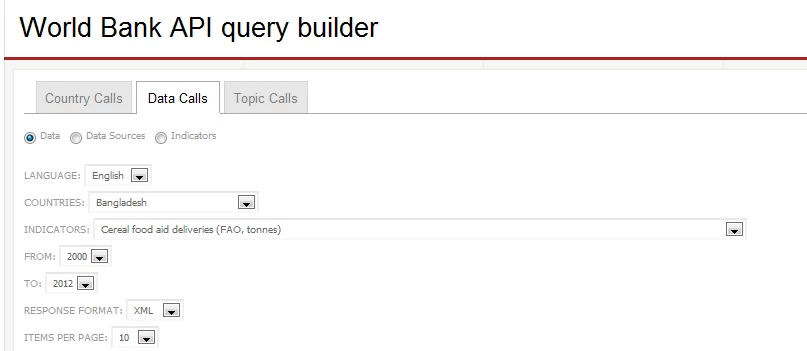
You know what an API is, right? It stands for Application Programming Interface, and it gives anyone online, direct access to live data, straight off our databases. There’s no need to manually download things: every time we update something, you’ll always have the latest version if you access it via the API.
It's easiest if you see for yourself - stick this link in (a new tab in..) your web browser's address bar:
http://api.worldbank.org/countries/BGD/indicators/NY.GDP.MKTP.KD.ZG?per_page=11&date=2000:2010
That not-so-scary looking XML is a structured representation of the last 10 years of GDP growth figures for Bangladesh - the key bit of the URL is the indicator code for GDP Growth, in this case “NY.GDP.MKTP.KD.ZG” . Can you see the unrounded figure of 6.1% for 2010 at the top?
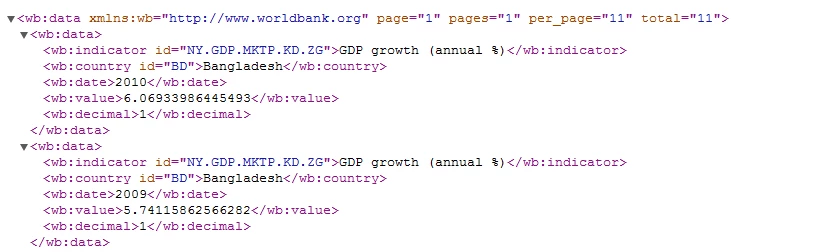
This is what mobile apps like Data Finder suck in and display to you in a prettier format. In fact, our entire website is built off these same public APIs - all we're doing is transforming this machine readable data into a World Bank branded data site. Doesn’t it sound easy when you say it like that?
If you're interested, we've got documentation on the APIs that we provide for various types of data. The development data API comes with a query builder to let you easily generate data like the above - mostly on time series indicators. There are also APIs to access our projects and operations data, our financial information and, most recently, data on climate change.
Oh, and if you're a STATA user, there's already a module that connects to the development data API so you can access live World Bank data directly from STATA.
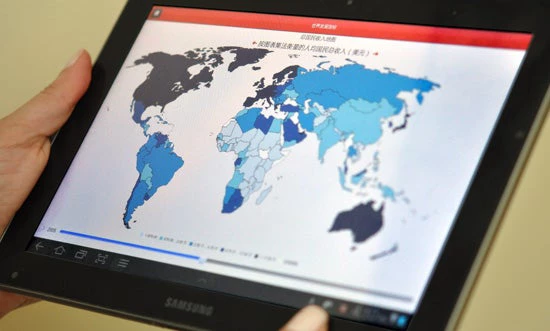
5) Google Search and Public Data Explorer
OK, this should really be at the top - the majority of people who see World Bank data these days get it via Google Search. If you haven't seen it (where have you been?), go and type in "GDP Growth Bangladesh" into Google search and see what happens. Go ahead - I'll wait for you.
Pretty cool, huh? Google takes all our open data from the WDI and translates it into 34 languages (try searching for "población de españa" in http://www.google.es) - Google then display data in your own language when they spot you typing in certain keywords.
It gets really exciting when you click on the little graph and arrive at the Public Data Explorer - another great free charting and visualization tool which you can use to create charts and embed them like this:
OK. these are my top 5 ways of accessing World Bank Data, what are yours?
Remember, open data at the World Bank is free to use, re-use and redistribute for commercial and non-commercial purposes (check our terms of use) - so you're just as likely to find our data through other platforms, interfaces and tools and I’d love to hear about them.
---
Bonus 1: The Data Catalog
Wait! I almost forgot about the Data Catalog. It's a central index of almost a hundred different databases from across the World Bank and it's growing every month.
Some are big, some are small, not all of them are accessible via the API, but almost all of them fall under our open data terms of use which as above means you can basically do what you like with the data as long as you attribute the source.
Bonus 2: The MicroData Catalog
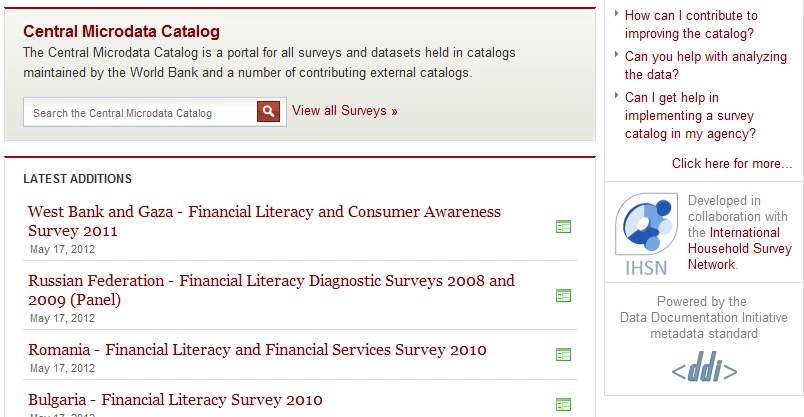
No, this isn't just a smaller version of the data catalog - microdata is a term the statisticians I'm surrounded by use to describe raw data from surveys, censuses, and administrative systems. This is really powerful stuff if you're a researcher and the World Bank Microdata Catalog is one of the best systems of its kind in the world - do check it out.
Bonus 3: The World Bank Finances Site and App
Want to know where the World Bank’s money goes? Check out finances.worlbank.org to get the latest data on our financial activities - you can easily create your own charts and visualizations and download data for your own use too.
The best bit for me is the mobile app - I have it on my iPad and iPhone and I can easily see which projects we have in a country when I’m travelling.
With more organizations publishing their financial and operational data in the IATI format, I’m looking forward to seeing more tools that show me where all money from all development organizations is being spent.

Join the Conversation