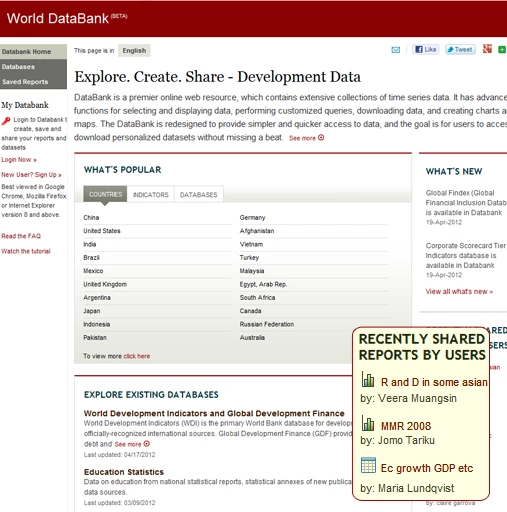
A number of World Bank Open Data users have been taking advantage of the new Databank. Databank offers over 8,000 indicators with which to create and save custom reports with tables, charts, or maps. The saved reports are updated automatically when the data are udpated. And you can revisit, share, and embed the tables, charts, or maps as widgets on websites or blogs. All of the reports that people have created for public sharing can be seen on the lower right portion of the screen on the new Databank site.
There are nearly 200 such reports that have been shared publicly. Here is an example of one showing financial flows to developing countries over the past few years.
Recently, I used these Databank tools to make a few charts which I embedded into a news story on the new World Development Indicators. I encourage everyone to try it out. And let us know what you think of the new features and any suggestions you have for us. What will you create with Databank?
Related links:

Join the Conversation