The Global Infrastructure Outlook is a landmark country-based online tool and report developed by the Global Infrastructure Hub with Oxford Economics, which forecasts infrastructure investment needs across 50 countries and seven sectors to 2040.
Although there are already forecasts for infrastructure investment in the market, the public and private sectors indicated their need for fresh, country-level data. Outlook was created to meet that knowledge gap.
For the first time we have data about what each country needs to spend in each sector, and importantly – the gap between what needs to be spent and current spending trends.
What do the results show?
By 2040, the global population will grow by almost 2 billion people – a 25% increase. Rural to urban migration will continue with the urban population growing by 46%, triggering massive demand for infrastructure support.
Outlook forecasts that global infrastructure investment needs to reach $94 trillion by 2040 to keep pace with profound economic and demographic changes across the globe.
Add the UN Sustainable Development Goals (SDGs) of universal provision of clean water, sanitation, and electricity, and the total cost rises to $97 trillion.
The analysis reveals a shortfall in needed spending of $18 trillion – 19% of the forecast need.
Closing the gap and meeting the SDGs will require spending as a proportion of global GDP to grow from the current level of 3% to 3.7%.
Beyond these global figures are the country and sector specific stories that represent the real challenge of finding and funding infrastructure projects that enhance people’s lives.
Key findings
1. Over half of global infrastructure investment needs are in Asia.
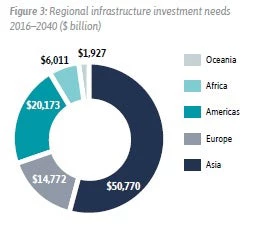 Three of the five countries with the greatest infrastructure need are in Asia (China, India and Japan), with those countries comprising 39% of global infrastructure investment needs. China alone is expected to need $28 trillion in infrastructure investment, which is more than half of Asia’s total needs and 30% of global needs.
2. The United States has the largest investment gap, forecast to be $3.8 trillion.
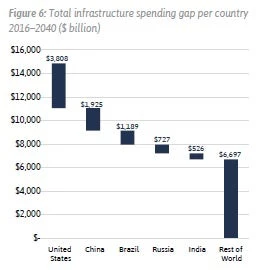 The United States is forecast to have the largest infrastructure investment gap – the difference between investment needs and current trends in investment – of $3.8 trillion, double the next largest of China at $1.9 trillion, followed by Brazil at $1.1 trillion and Russia at $0.7 trillion.
3. On current trends in investment the world will fall short of meeting the SDGs by 2030.
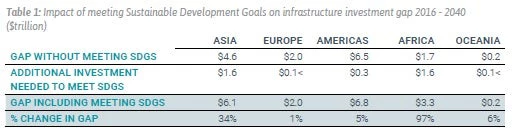
Outlook looked specifically at the goals to ensure universal access to clean water and sanitation, and electricity supply (SDGs 7.1, 6.1 and 6.2).
What it found is concerning and should be a global wake up call.
Our analysis shows to meet these goals would cost $5.8 trillion from now until 2030. We estimate that $3.5 trillion of this figure – more than 50% – will not be met by 2030.
4. The majority of global infrastructure investment gap is in the road and electricity sectors.
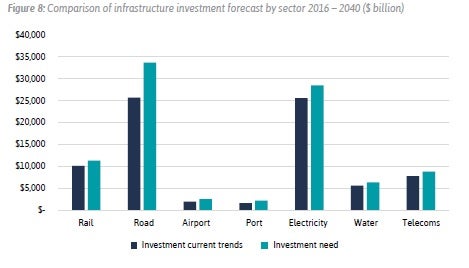
Outlook estimates an $8 trillion infrastructure investment gap in roads, which represents more than half of the total global infrastructure investment gap. Although the electricity sector represents the second largest infrastructure investment gap at $2.9 trillion, the majority of that gap is in developing and emerging countries.
Innovative methodology
Outlook involved over a year’s work applying around 50 datasets and a unique approach to forecasting infrastructure investment needs.
We applied a detailed top-down statistical approach, which used seven bespoke econometric models to produce 350 forecasts covering each of the 50 countries and seven sectors. These forecasts take into account past spending, countries’ specific economic and demographic characteristics, and the current quality of infrastructure.
Outlook is accessed via our report and through our online tool where data can be customized and downloaded: http://outlook.gihub.org.
We anticipate that Outlook will become a useful source of data and guidance to governments seeking to reform and improve their infrastructure markets.
It will complement our other tools:
- InfraCompass, a tool identifying the key drivers of successful planning and delivery, and allows jurisdictions to focus on the most important drivers affecting their infrastructure market.
- Project Pipeline, an online platform with early stage data on government infrastructure projects to help the private sector.
- Allocating Risks in Public-Private Partnerships, a guide to typical risk allocation in infrastructure projects between public and private partners.
- Multilateral Development Bank Report for G20, key advice to G20 on how these banks can work to “crowd-in” private finance for public infrastructure.
- Concession Management of Public-Private Partnership Projects, practical guidelines for project authorities to help concession management of PPPs to be released later this year.
You can also follow the Global Infrastructure Hub on Twitter.
Disclaimer: The content of this blog does not necessarily reflect the views of the World Bank Group, its Board of Executive Directors, staff or the governments it represents. The World Bank Group does not guarantee the accuracy of the data, findings, or analysis in this post.
Related Posts from the GI Hub:
InfraCompass: Helping governments set their infrastructure policies in the right direction
The Global Infrastructure Project Pipeline: Linking private investors with public infrastructure projects
A field guide to infrastructure

Join the Conversation