Amanda Ripley’s new book, The Smartest Kids in the World: And How They Got That Way, is gaining a lot of attention for the accessible way she demonstrates how high achieving countries got that way. While she provides useful insights into the usual suspects: Finland, Korea and Poland (a not so usual suspect), there are lessons waiting to be learned from other places, the least likely suspects, in other words, middle and lower income countries. While this analysis is useful, what policy makers in developing countries ask me is, “Why should we participate in international assessments?” They are concerned with being ranked at the bottom and having nothing to show for their efforts.
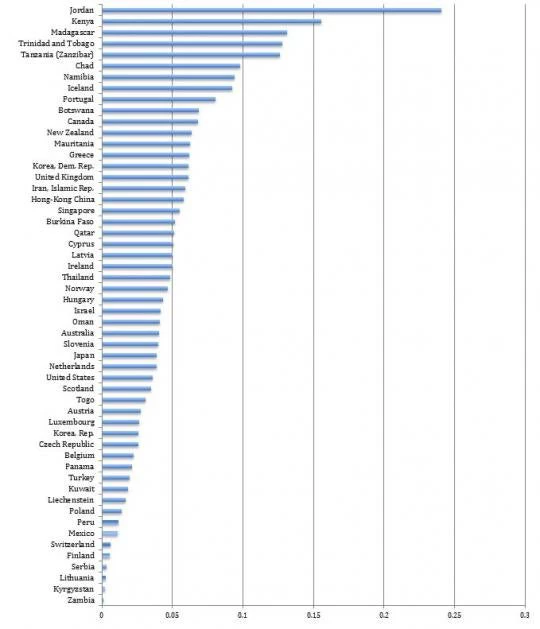
In our paper, An expansion of a global data set on educational quality: a focus on achievement in developing countries, we make use of existing sources of test score information to show that there are less-developed countries that have made major educational gains. Our comparison of test score gains from 1995-2010 for 93 countries gives us a novel list of top performers over the last 15 years. The top improvements come from Jordan, Kenya, Madagascar, Trinidad and Tobago, Tanzania, Chad, Namibia, Iceland, Portugal, Botswana and Canada. Many recent top performers are developing countries, even if they are improving from a very low base.
By showcasing educational achievement on an internationally comparable scale, we reveal “hidden” gains by developing countries.
We can further introduce cross-country and time-varying dimensions into our expanded dataset to determine causal inputs in effective education systems. Thus, our paper can enable policymakers and researchers to determine and target meaningful education reforms for countries that need it most.
Access to comparable data can better inform what can be done to improve learning outcomes. Data addresses the biggest shortcoming to such knowledge generation.
We build on a novel methodology (based on Altinok and Murseli 2007) to create an expansive database on internationally comparable test scores. We do this in two ways.
First, while many developing countries do not participate in international tests such as PISA and TIMMS, they do participate in regional assessments. We make these tests comparable to international assessments by using doubloon countries – countries that participate in both regional and international assessments – as an index to transform non-doubloon countries’ regional assessments. In so doing, we effectively account for each test’s varying rigor and scale. Second, we link different tests by fixing them to the cognitive performance of the United States. This approach allows us to incorporate a time dimension into our analysis, since the United States has participated in almost all international assessments since their inception. In addition, the U.S. has administered the National Assessment of Educational Progress (NAEP) nearly biannually since the 1960s. Thus, the U.S. provides a good anchor point across countries and over time, enabling us to generate a uniform database of international achievement.
Ultimately, we developed a massive database consisting of 128 countries, over 40 of which are located in the developing world. This database captures test scores from 1965-2010 in five-year steps.
Average Annual Improvement in Adjusted Test Scores (1995-2010)
(percentages)


Join the Conversation