
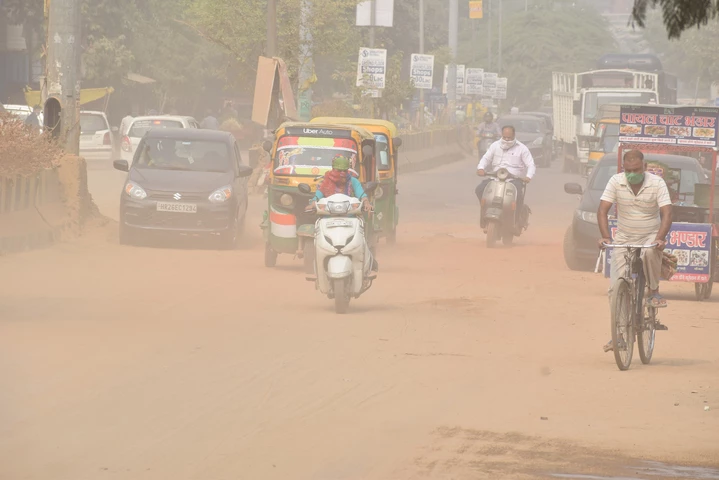
 A new World Bank dataset provides daily PM₂.₅ estimates for more than 32,000 cities, combining satellite, ground-monitoring, weather, emissions, and geographic data. Pictured, dustywinds increase pollution in Gurgaon, India. / Image: Shutterstock
Ambient air pollution — driven by emissions from transport, industry, power generation, and biomass burning — is a major source of health damage and economic loss, particularly in developing countries. Evidence from the World Health Organization and global monitoring initiatives such as IQAir shows that rapid urban growth has pushed ambient concentrations of fine particulates (PM₂.₅), ozone (O₃), nitrogen dioxide (NO₂), and carbon monoxide (CO) well beyond recommended guidelines in many regions (WHO 2021; IQAir 2025; Health Effects Institute 2024). Recent global assessments attribute 8.1 million premature deaths and 120 million disability-adjusted life years to air pollution, and approximately US$8.1 trillion in annual economic losses to PM₂.₅ exposure alone (Health Effects Institute 2024; Feng et al. 2025; World Bank 2022). Yet sparse monitoring systems in many countries limit accurate pollution exposure assessment and policy evaluation, highlighting the need for consistent, high-resolution air quality data.
What is needed? High-resolution and comparable air quality data
Reliable air pollution data are critical for effective environmental and public health policy, yet consistent, high-resolution estimates remain scarce across much of the world.
Accurate local observations are essential for identifying exposure hotspots, distinguishing local from transboundary sources, and assessing chronic exposure across populations and ecosystems. Recent advances in publicly-available satellite measurements, ground monitoring reports and computer tools now make such analyses feasible that are global in reach, near real-time frequency, and standardized in methodology.
Building on this progress, we developed and piloted a machine-learning framework to estimate daily ambient air quality by integrating satellite-measured pollutant concentrations, meteorological data, emissions flux estimates, and geographic information. The result is a harmonized dataset for each pollutant that can be updated continuously and applied consistently across countries and regions with a one-week lag. Because PM₂.₅, O₃, NO₂, and CO differ in sources, atmospheric behavior, health impacts, and mitigation pathways, pollutant-specific estimation is essential for accurate exposure assessment and targeted policy design. Estimating each pollutant separately gives decision-makers the granularity to move from general air quality concerns to specific interventions.
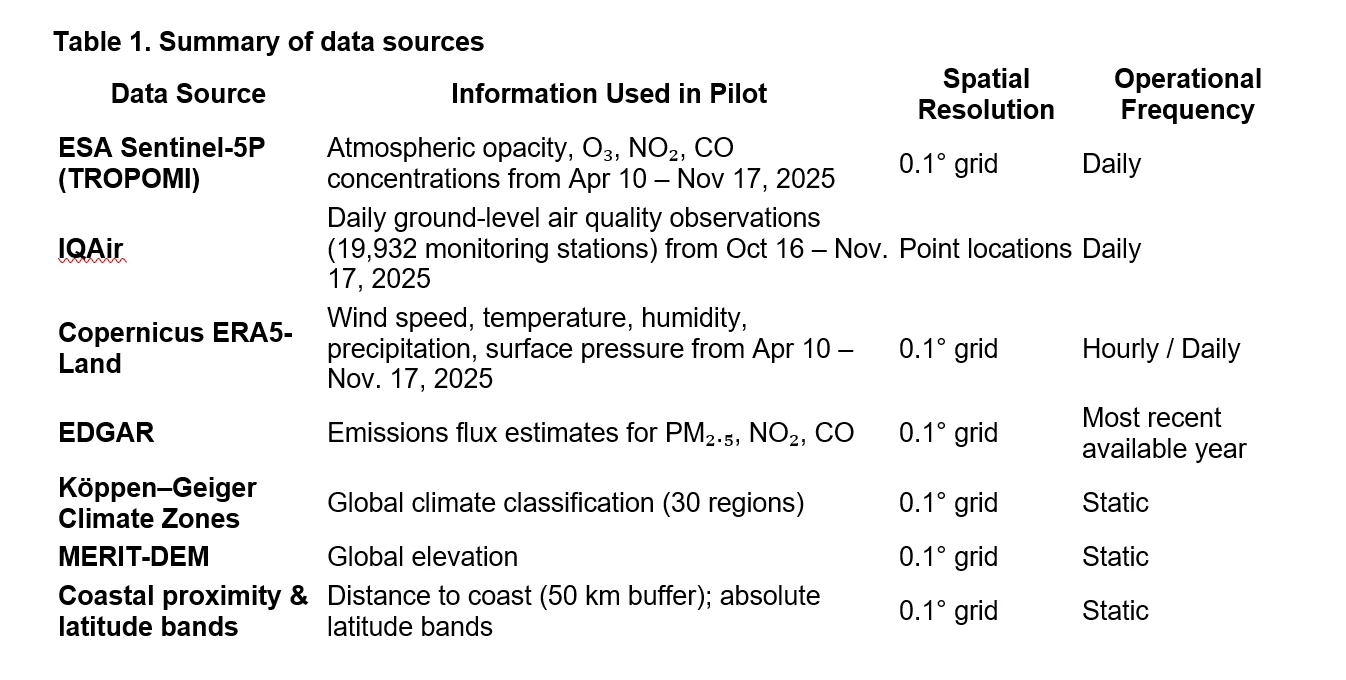
Our work is based entirely on open-access, freely-available information, including data from European Space Agency’s (ESA) Sentinel-5P (TROPOMI) satellite platform and thousands of IQAir ground monitoring units. For global consistency, our approach combines all needed datasets into a common 0.1° spatial grid for the pilot period April 10, 2025, to November 17, 2025.
How do we estimate daily ambient air pollution?
Our models for daily concentrations of PM₂.₅, O₃, NO₂, and CO are estimated using a random forest machine-learning algorithm implemented in R (ranger). The models link observed pollution levels at monitoring stations to satellite observations, weather conditions, emissions inventories, and geographic characteristics.
A separate model is estimated for each pollutant to reflect differences in emissions sources and atmospheric behavior. All models use common weather and geographic variables, combined with pollutant-specific information from the ESA and EDGAR databases.
To ensure accurate estimates, monitoring stations are randomly divided into training (60%), calibration (20%), and test (20%) sets prior to model estimation. Calibration corrects systematic over- or under-prediction, and model accuracy is assessed using the independent test observations.
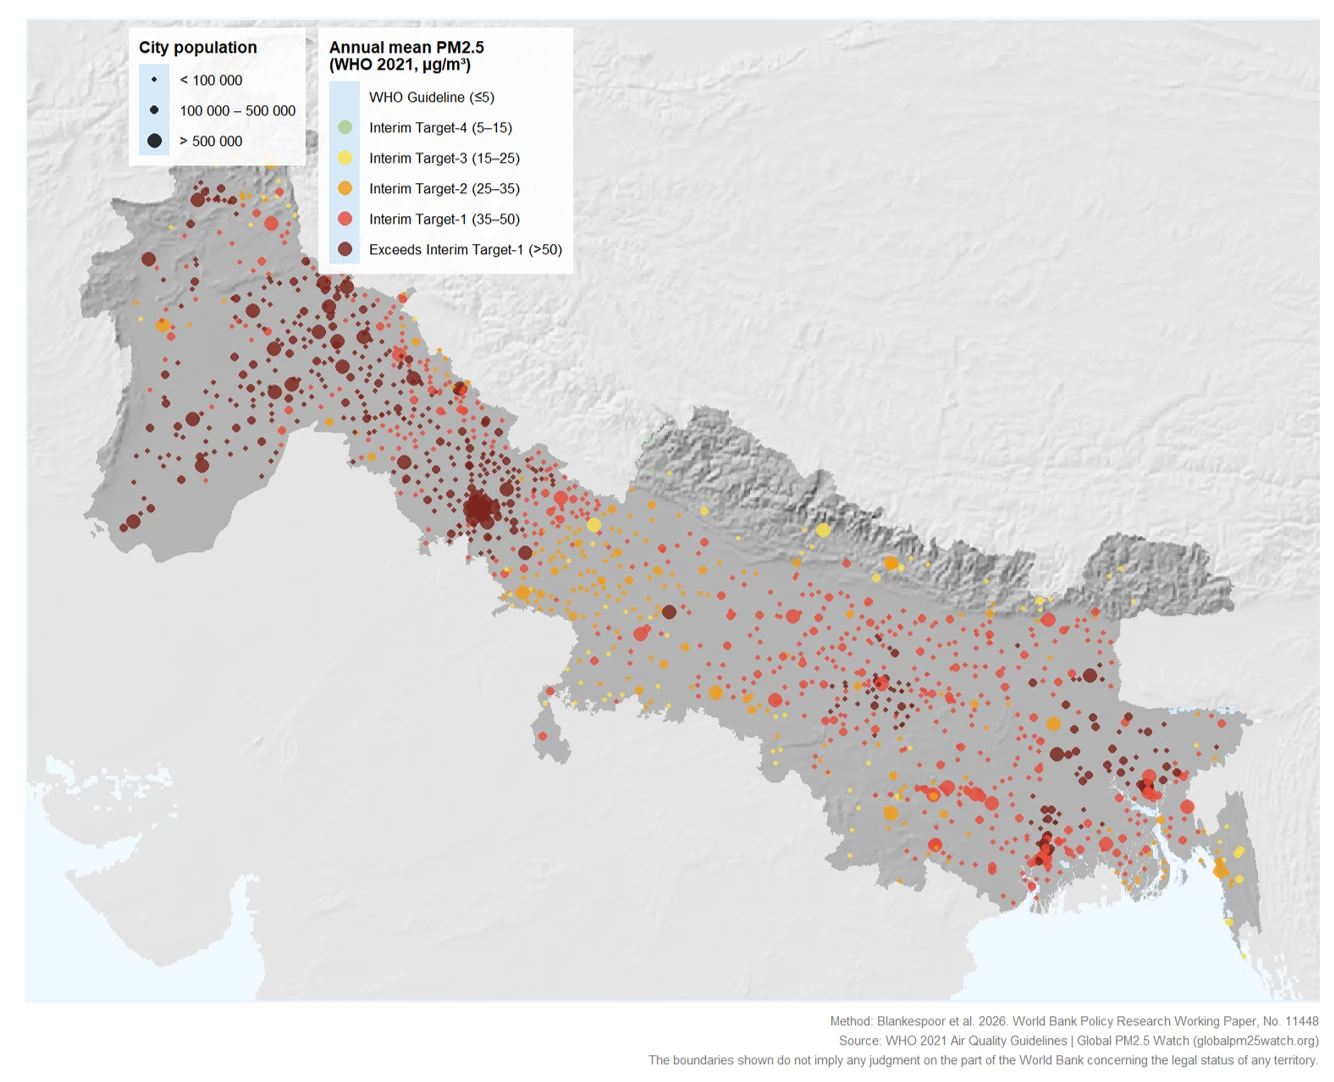
Results from the pilot show that the machine-learning approach can provide daily PM₂.₅, O₃, NO₂, and CO estimates for any urban area (See Figure 1). These high-resolution estimates can support regulatory planning, investment, and policy evaluation by identifying pollution hotspots, informing standards and enforcement, distinguishing local from regional patterns, and tracking policy effectiveness through consistent daily time series. Combined with population data, they can also help target interventions — such as cleaner household energy, transport electrification, power-sector reform, and waste-burning controls — where they can deliver the greatest health benefits.
Figure 1. City-level mean PM2.5, September 2025–August 2026 — Indo-Gangetic Plain and Himalayan Foothills Airshed
With timely satellite, ground-monitoring, and weather data, the framework could provide near-real-time daily air-quality information for pollution warnings and more responsive regulation. Combined with weather forecasts, it could support short-term forecasting to anticipate pollution episodes, while regularly updated, comparable indicators would strengthen long-term trend monitoring, national reporting, and assessment of progress toward clean-air goals.
From pilot to an operational air quality informational system
The pilot has already been extended for PM₂.₅ through a dedicated website, expanding the dataset on the Development Data Hub to more than 32,000 cities globally, covering October 2018 to August 2026. The framework could also be extended to O₃, NO₂, and CO, and operationalized by automating the incorporation of newly available satellite, ground-monitoring, and weather data to allow near-real-time updates across all four pollutants for individual cities or globally. This would require sufficiently short data-reporting lags together with automated processing and quality control.
Access the working paper pilot dataset here.
Read the detailed methodology in our Policy Research Working Paper.
This initiative is part of the Space2Stats Program, supported by a grant from the World Bank’s Global Data Facility and financed by the European Commission’s Directorate-General for Regional and Urban Policy (DG REGIO). Its goal is to enhance data disaggregation, availability, and standardization, while advancing research and insights on subnational development challenges, including climate, biodiversity, clean energy, and gender dimensions.
Selected References
Urban ambient air pollution
IQAir. 2025. World's most polluted cities, 2017-2024
https://www.iqair.com/us/world-most-polluted-cities
Health impacts of ambient air pollution
Feng, J., Y. Wang, X. Meng and Y. Fang. 2025. Global trends in disease burdens attributable to ambient and household air pollution: a comparative study of ten populous countries. Front. Public Health. 13:1629616.
https://www.frontiersin.org/journals/public-health/articles/10.3389/fpubh.2025.1629616/full
Health Effects Institute. 2024. State of Global Air 2024. Boston, MA: Health Effects Institute.
https://www.stateofglobalair.org/resources/archived/state-global-air-report-2024
World Health Organization (WHO). 2021. WHO Global Air Quality Guidelines: Particulate Matter (PM₂.₅ and PM₁₀), O₃, NO₂, SO₂ and CO. 2021.
https://www.who.int/publications/i/item/9789240034228
Economic impacts of ambient air pollution
World Bank. 2022. The Global Health Cost of PM₂.₅ Air Pollution: A Case for Action Beyond 2021.
IQAir. 2025. World's most polluted cities, 2017-2024



Join the Conversation