Consumption or income, valued at prevailing market prices, is the workhorse metric of economic welfare – poverty is almost universally defined in these terms. In low- and middle-income countries these measures of household resource availability are typically assessed through household surveys. Yet the global diversity in survey approaches is vast, with little rigorous evidence concerning which particular approach yields the most accurate resource estimate. (Indeed there may be no one approach that best suits every context – more on this below.)
With this question in mind, Kathleen Beegle, Joachim DeWeerdt, John Gibson, and I conducted a survey measurement experiment in Tanzania that randomized common survey approaches to consumption measurement across a representative sample of households in Tanzania. Previous papers have explored the relative performance of the approaches in terms of mean consumption, inequality, poverty, and the prevalence of hunger (see these papers here, here, and here). Our new working paper seeks to push this data further to understand the nature of the reporting errors that underlie the mean estimates.
Our approach is a simple decomposition that notes total consumption is really a product of two vectors: (1) a vector that indicates whether the household reports any positive value of consumption for each of the individual food items listed, and (2) a vector reporting the value of that consumption. This decomposition allows for an exploration of the relative importance of the different types of reporting error in the survey designs studied and, further, how reporting error can vary by individual commodity characteristics.
In our experiment the “true” consumption is never known, of course. However an individual-level diary supervised on a regular basis is taken as the benchmark, or gold standard, survey approach. This approach is expensive and therefore not recommended for large scale surveys. However this approach was adopted as our benchmark because we believe the scope of the resources and the care teams devoted to the survey minimized various types of reporting error, including these four main types of error described here:
- Recall error. A main concern is that respondents forget the occurrence of a consumption event. This can result in recall error. Lower salience and longer recall periods make forgetfulness more likely among respondents. Several studies show that, all else equal, the longer the period of recall, the lower the reported consumption per standardized unit of time.
- Telescoping. The converse of recall error, telescoping is when a household compresses consumption that occurred over a longer period of time into the reference period and thus reports consumption greater than the actual value.
- Rule of thumb error. Respondents may not always recall and count events. Particularly for longer recall periods that typically involve more transactions, respondents may cease trying to enumerate each and instead use rules of thumb to estimate them. In this case, rule of thumb error may depend on transaction frequency and regularity; less frequent items are likely reported with more error. Whereas recall error biases the consumption estimate downward, and telescoping creates upward bias, there is no obvious direction of bias in responses that resort to the rule of thumb instead of enumeration.
- Personal leave out error. Yet another source of reporting error is the inability to accurately capture the individual consumption of household members if it occurs outside the purview of the survey respondent. This may be more significant for certain types of food, such as snacks or meals taken outside the home, or for personal goods such as mobile telecommunications. The degree of inaccuracy is likely to increase with the number of adult household members and with the diversity of the activities of these members outside the home.
While our working paper contrasts all tested survey modules with the benchmark, we focus here on the two most common recall designs, one asking a detailed list of all food consumed in the past 7-days, and the other seeking recall over the past 14-days. We also compare the benchmark with the same structured diary, supervised to the same degree, but this time only kept at the household level – this comparison of the benchmark with the household-level diary is meant to highlight the particular role of personal leave-out error.
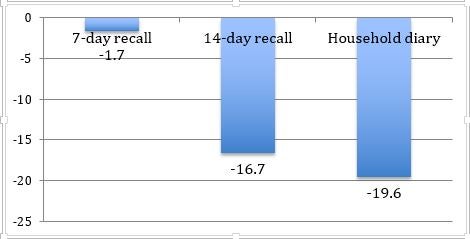
Figure 1 summarizes the mean difference in per capita total food consumption between the three common designs and our benchmark. While many types of response error can be at play, we see that the 7-day recall comes very close to the benchmark consumption value. On the other hand, the 14-day recall and household diary are 16-19 percent lower. It is very tempting to conclude from these mean comparisons that the 7-day recall, the one closest to the benchmark, should be promoted over other approaches – the 14-day recall module appears to be subject to greater net recall error and the household diary likely misses important individual-level consumption thus resulting in assessed consumption shortfalls.
Figure 1. Percentage shortfall in total assessed food consumption, by module, compared with the benchmark personal diary
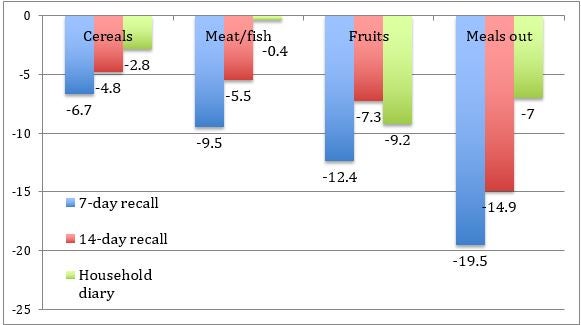
Yet perhaps this conclusion is premature, or at least may not translate to other settings. We say this because of the decomposition exercise. Figure 2 compares the relative error in the incidence of consumption for a representative four major food groups. These errors are all negative. In fact they are largest in magnitude for the 7-day recall. The 14-day recall is also negative, to a smaller degree. It is clear that the omission of any consumption is a cause of downward bias and a major contributor to what constitutes total recall error. The incidence error in the household diary also shows which food groups, such as fruit or meals outside the home, are most subject to personal leave out error.
Figure 2. % difference in consumption incidence of select food groups as compared to the benchmark
Let’s now contrast the incidence error pattern with the error in reported consumption value (conditional on positive consumption). The magnitudes of these errors are shown in Figure 3. For the 7-day recall, while consumption incidence is downward biased, the reported values exhibit a large degree of upward bias for most food groups. This suggest that either telescoping, or rule of thumb error resulting in overvaluation, is most pronounced in the short 7-day window. Thus it appears that the “accuracy” of the 7-day recall to the benchmark derives from the happenstance of offsetting errors: negative errors in incidence multiplied by positive errors in value. This approximately equal offsetting error magnitude may not translate to other settings.
Figure 3. % difference in consumption value of select food groups as compared to the benchmark
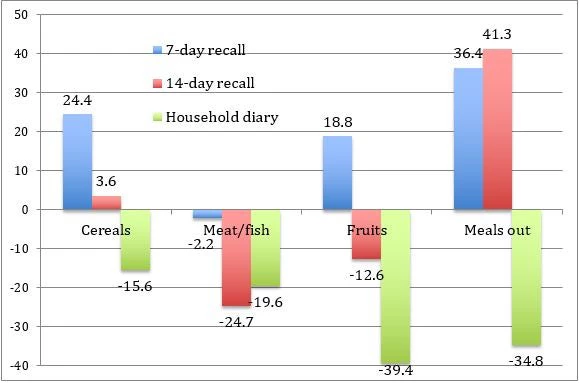
The 14-day recall module also exhibits positive value errors for some food groups, but to a lesser degree than the 7-day period. The 14-day recall also exhibits net negative error for other, mostly perishable food groups. This suggests the recall period that yields the greatest accuracy likely varies with the nature of the good in question. Relatedly, the deviations in consumption value for the household diary are larger for certain goods, such as fruit and meals outside the home, which are likely consumed by individual members outside the purview of the keeper of the household diary.
This simple decomposition exercise raises some stark patterns in differential response error according to survey desigin and suggests that methods to improve the accuracy of recall surveys should consider a dual-track approach: (1) efforts related to the prompting of households to accurately report any positive consumption, as recall modules appear to underreport consumption incidence of almost any food group and (2) efforts aimed at improving the accuracy of consumption value reporting, conditional on the household reporting any consumption.
Regarding efforts to improve the accuracy of consumption incidence data, further analysis at the individual food item level reveals that the absolute magnitude of recall error is particularly high for foods that are not commonly consumed. Might further prompting in the interview and perhaps the use of locally salient images to aid the memory of survey respondents improve incidence recall, especially for less common food items?
Regarding efforts to improve the accuracy of consumption value reports, note that over-reporting of value is a particularly prominent error for short recall periods such as seven days. Unlike the incidence error, we do not have a strong lead on what causes the misreports. If telescoping of high-value consumption items is the driver, then one approach sporadically discussed in the literature is to bracket the recall period with a surveyor visit at the start of the relevant period as a reference for the respondent during the second visit when the recall is reported. The initial visit from a survey team may help delineate the exact period of recall and improve accuracy. However, this approach would need to be validated before being taken up more broadly. It also has consequences for fieldwork structure and cost (in cases where mobile teams rather than resident enumerators are used).
Hopefully future studies in other settings (fortunately I know of at least two in the field right now) will establish the generalizability of any findings reported here or, at least, further our understanding of survey performance in different contexts. In the longer run, reliable administrative data systems should yield estimates of household consumption, but we will likely need to rely on specially collected survey data in low-income countries for many years to come.

Join the Conversation