This year’s global poverty update from the World Bank is a
minor one. Until reference year 2008, the World Bank published new poverty estimates every three years, and between 2010 and 2013 we released new numbers every year (see
here). From now on, we plan to publish estimates of global poverty for a new reference year
every other year, coinciding with the publication of the biennial
Poverty and Shared Prosperity reports, in the autumn of even years.
This management decision reflects a recognition that changes in global and regional poverty estimates from one year to the next are typically small, particularly in relation to the likely uncertainties involved in these estimates (e.g. see World Bank, 2017, p. 49ff.). Furthermore, many developing countries do not field household surveys every year. For these countries, changes from one year to the next are often based on extrapolation methods, which may give rise to additional estimation errors. The Bank’s next major update of global and regional poverty estimates is scheduled for October 2018, when we plan to release global poverty estimates for reference year 2015.
On off-years, like 2017, minor updates and corrections will be made to the previous year’s numbers, incorporating any relevant new information we may have received. In this spirit, we have just published revised global and regional poverty estimates for 2013. These estimates update the poverty numbers for 2013 originally released in October 2016, and reflect several methodological improvements, as well as some new underlying country-level data. These numbers are published on PovcalNet, which is an interactive tool that allows users to replicate the official World Bank poverty estimates.
This blog describes the main features of this 2017 PovcalNet update, namely: (i) a ‘truly global’ approach to poverty measurement; (ii) progress on resolving some of the outstanding issues with the 2011 PPP exchange rates; and (iii) a few changes to the underlying welfare aggregates in some countries. A relatively big change is that we now report global and regional poverty estimates for two additional poverty lines, $3.20 and $5.50, in addition to the $1.90/day International Poverty Line. This change is large enough to deserve its own, separate blog, which you can find here. Full details of all the technical changes in PovcalNet for this year can be found in the "What's new" section.
A ‘truly global’ approach to poverty measurement
Until this year, we had assumed in our global aggregation that the “other high income economies” had no people living in extreme poverty. This group approximately covers the traditional rich countries that are not eligible to borrow from the World Bank (see World Bank, 2016, p. 49 for the full list). In its early days, PovcalNet did not include any income or expenditure distributions from these countries. After all, these are countries where the World Bank has no regular policy dialogue or active lending. With the advent of the World Bank’s Shared Prosperity goal, which applies to all countries, the “other high income economies” were added to the database. But we continued to assume that there were no people below the global extreme poverty line in these countries, which was approximately correct, since the number of observations below this threshold was very small.
However, as Prof. Anthony Atkinson pointed out in his report of the Commission on Global Poverty, this assumption is inconsistent with a ‘truly global’ approach to poverty measurement ( World Bank, 2017, p. 47). Ending extreme poverty is part of the Sustainable Development Goals, which are meant to be “global in nature and universally applicable” ( United Nations 2015, para 55), thus calling for a poverty measure that covers the entire world population. The Atkinson Commission therefore advised that we should bring these countries into the scope of our analysis. Beginning with this update, we include poor people who live in the “other high income economies” in our global aggregate (and report them as a separate region).
The 2011 PPP Exchange Rates Strike Back
When the 2011 purchasing power parity (PPP) exchange rates were first published, in 2014, we were concerned about the reliability of the official PPP exchange rates in several countries, for example due to poor coverage or quality of the underlying price collection, or large discrepancies between CPI- and PPP-based inflation rates (see Ferreira et al., 2016). Over the last 12 months, we have been able to gradually resolve these issues, albeit in different ways for different countries. In this update, we use regression-based PPP exchange rates, estimated from a revised model, for Egypt, Iraq, Jordan, Lao PDR, Myanmar and Yemen. In Cambodia, our analysis revealed issues with the household survey-based welfare aggregate, producing poverty rates that were much lower than what might be expected on the basis of national accounts or non-income welfare indicators. Therefore, we have removed the Cambodia data pending further analytical work to improve the reliability of the consumption aggregate – to be carried out in collaboration with the national statistical agency. (As usual with missing countries, in the regional and global averages Cambodia is now assumed to have the average poverty incidence in the East Asia and Pacific region.)
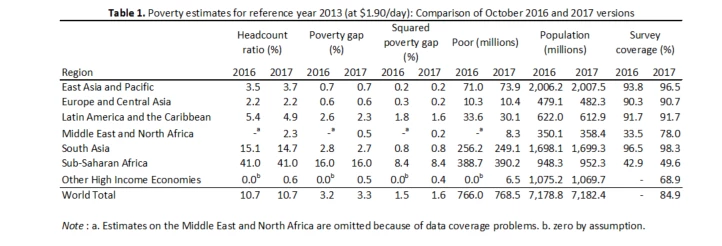
The resolution of these remaining issues with the 2011 PPPs, as well as the availability of new survey data, means that we can now report a regional poverty estimate for the Middle East and North Africa region in 2013 (population coverage is 78%, see Table 1). Poverty rates for a region are only reported when the available surveys cover at least 40 percent of the population in that region. This is the first regional poverty estimate for the Middle East and North Africa since 2008, which is when the region last reached this threshold.
Selected changes to welfare aggregates for some countries
In several countries, the welfare aggregate used in PovcalNet is adjusted for within-country spatial price differences. Adjusting for cost-of-living differences across regions within a country provides a more accurate representation of well-being. Ferreira et al., 2016 describe the adjustment for China, India and Indonesia, as well as for the countries in the Latin America and the Caribbean and Europe and Central Asia regions. Beginning in October 2017, we have also incorporate a spatial price adjustment in the following countries in East Asia and the Pacific: Kiribati, Lao PDR, Papua New Guinea, Philippines, Timor-Leste, Tonga, Tuvalu, Vietnam, Vanuatu, and Samoa.
Some of the income surveys in our database have a small number of observations with negative incomes. This applies especially to the “other high income economies”, as well as to some countries in Europe and Central Asia. These observations are typically the result of negative profits for self-employed individuals. The observed negative income is unlikely to reflect the permanent income of the household. It also does not reflect household consumption for this year, since households smooth their consumption from one year to the next, and consumption expenditure by definition cannot be negative. In other words, for those negative income households, we do not observe a level of income or consumption expenditure that would be a good predictor of their welfare in this year, so we have decided to drop these observations from the underlying distributions. This is consistent with our approach for countries in Latin America and the Caribbean (see SEDLAC methodological documents, p. 20). We view this as a temporary fix until we can develop a better method to impute a more meaningful level of income or consumption for these observations.
We do however, include observations reporting zero incomes in these countries – again, as we do for Latin America. These observations should not be interpreted as corresponding to zero consumption. This is a long-standing issue concerning the comparability of poverty statistics across consumption and income distributions. It has not been resolved, and further work is clearly needed, but data users interpreting poverty numbers for rich countries should bear it in mind.
In addition, “routine maintenance and expansion” of PovcalNet continues as usual. Over the last year, a number of new household surveys – both older and more recent - have been added to the World Bank’s global database, bringing the total count of household surveys to over fifteen hundred. Many surveys have also been updated, reflecting corrections and improvements to the data sources. In particular, all the estimates drawn from the Luxembourg Income Study (used for some of the “other high income economies”) have been updated. Finally, a previously unavailable household survey for Haiti included consumption expenditures as an indicator of well-being, whereas previous data was income-based. The use of the consumption data, which always takes precedence in PovcalNet, led to a substantial decline in poverty estimates for Haiti and thus a decline in the extreme poverty rate in Latin America.
Do these changes make a difference to the numbers?
Table 1 compares the 2016 and 2017 versions of the global and regional poverty estimates for 2013, using the International Poverty Line of 1.90/day. Compared to the estimates produced in October 2016, the total number of poor increased by 2.5 million (from 766.0 to 768.5 million), leaving the share of the global population that is considered extremely poor unchanged at 10.7 percent. It is clear from the table that this update does not change our broad conclusions about extreme poverty at the global level. But we believe that these new numbers provide a more accurate and reliable portrait at the country and regional levels, and substantially enhanced coverage, particularly in the Middle East and North Africa, and among the high-income economies that do not borrow from the Bank.
This management decision reflects a recognition that changes in global and regional poverty estimates from one year to the next are typically small, particularly in relation to the likely uncertainties involved in these estimates (e.g. see World Bank, 2017, p. 49ff.). Furthermore, many developing countries do not field household surveys every year. For these countries, changes from one year to the next are often based on extrapolation methods, which may give rise to additional estimation errors. The Bank’s next major update of global and regional poverty estimates is scheduled for October 2018, when we plan to release global poverty estimates for reference year 2015.
On off-years, like 2017, minor updates and corrections will be made to the previous year’s numbers, incorporating any relevant new information we may have received. In this spirit, we have just published revised global and regional poverty estimates for 2013. These estimates update the poverty numbers for 2013 originally released in October 2016, and reflect several methodological improvements, as well as some new underlying country-level data. These numbers are published on PovcalNet, which is an interactive tool that allows users to replicate the official World Bank poverty estimates.
This blog describes the main features of this 2017 PovcalNet update, namely: (i) a ‘truly global’ approach to poverty measurement; (ii) progress on resolving some of the outstanding issues with the 2011 PPP exchange rates; and (iii) a few changes to the underlying welfare aggregates in some countries. A relatively big change is that we now report global and regional poverty estimates for two additional poverty lines, $3.20 and $5.50, in addition to the $1.90/day International Poverty Line. This change is large enough to deserve its own, separate blog, which you can find here. Full details of all the technical changes in PovcalNet for this year can be found in the "What's new" section.
A ‘truly global’ approach to poverty measurement
Until this year, we had assumed in our global aggregation that the “other high income economies” had no people living in extreme poverty. This group approximately covers the traditional rich countries that are not eligible to borrow from the World Bank (see World Bank, 2016, p. 49 for the full list). In its early days, PovcalNet did not include any income or expenditure distributions from these countries. After all, these are countries where the World Bank has no regular policy dialogue or active lending. With the advent of the World Bank’s Shared Prosperity goal, which applies to all countries, the “other high income economies” were added to the database. But we continued to assume that there were no people below the global extreme poverty line in these countries, which was approximately correct, since the number of observations below this threshold was very small.
However, as Prof. Anthony Atkinson pointed out in his report of the Commission on Global Poverty, this assumption is inconsistent with a ‘truly global’ approach to poverty measurement ( World Bank, 2017, p. 47). Ending extreme poverty is part of the Sustainable Development Goals, which are meant to be “global in nature and universally applicable” ( United Nations 2015, para 55), thus calling for a poverty measure that covers the entire world population. The Atkinson Commission therefore advised that we should bring these countries into the scope of our analysis. Beginning with this update, we include poor people who live in the “other high income economies” in our global aggregate (and report them as a separate region).
The 2011 PPP Exchange Rates Strike Back
When the 2011 purchasing power parity (PPP) exchange rates were first published, in 2014, we were concerned about the reliability of the official PPP exchange rates in several countries, for example due to poor coverage or quality of the underlying price collection, or large discrepancies between CPI- and PPP-based inflation rates (see Ferreira et al., 2016). Over the last 12 months, we have been able to gradually resolve these issues, albeit in different ways for different countries. In this update, we use regression-based PPP exchange rates, estimated from a revised model, for Egypt, Iraq, Jordan, Lao PDR, Myanmar and Yemen. In Cambodia, our analysis revealed issues with the household survey-based welfare aggregate, producing poverty rates that were much lower than what might be expected on the basis of national accounts or non-income welfare indicators. Therefore, we have removed the Cambodia data pending further analytical work to improve the reliability of the consumption aggregate – to be carried out in collaboration with the national statistical agency. (As usual with missing countries, in the regional and global averages Cambodia is now assumed to have the average poverty incidence in the East Asia and Pacific region.)
The resolution of these remaining issues with the 2011 PPPs, as well as the availability of new survey data, means that we can now report a regional poverty estimate for the Middle East and North Africa region in 2013 (population coverage is 78%, see Table 1). Poverty rates for a region are only reported when the available surveys cover at least 40 percent of the population in that region. This is the first regional poverty estimate for the Middle East and North Africa since 2008, which is when the region last reached this threshold.
Selected changes to welfare aggregates for some countries
In several countries, the welfare aggregate used in PovcalNet is adjusted for within-country spatial price differences. Adjusting for cost-of-living differences across regions within a country provides a more accurate representation of well-being. Ferreira et al., 2016 describe the adjustment for China, India and Indonesia, as well as for the countries in the Latin America and the Caribbean and Europe and Central Asia regions. Beginning in October 2017, we have also incorporate a spatial price adjustment in the following countries in East Asia and the Pacific: Kiribati, Lao PDR, Papua New Guinea, Philippines, Timor-Leste, Tonga, Tuvalu, Vietnam, Vanuatu, and Samoa.
Some of the income surveys in our database have a small number of observations with negative incomes. This applies especially to the “other high income economies”, as well as to some countries in Europe and Central Asia. These observations are typically the result of negative profits for self-employed individuals. The observed negative income is unlikely to reflect the permanent income of the household. It also does not reflect household consumption for this year, since households smooth their consumption from one year to the next, and consumption expenditure by definition cannot be negative. In other words, for those negative income households, we do not observe a level of income or consumption expenditure that would be a good predictor of their welfare in this year, so we have decided to drop these observations from the underlying distributions. This is consistent with our approach for countries in Latin America and the Caribbean (see SEDLAC methodological documents, p. 20). We view this as a temporary fix until we can develop a better method to impute a more meaningful level of income or consumption for these observations.
We do however, include observations reporting zero incomes in these countries – again, as we do for Latin America. These observations should not be interpreted as corresponding to zero consumption. This is a long-standing issue concerning the comparability of poverty statistics across consumption and income distributions. It has not been resolved, and further work is clearly needed, but data users interpreting poverty numbers for rich countries should bear it in mind.
In addition, “routine maintenance and expansion” of PovcalNet continues as usual. Over the last year, a number of new household surveys – both older and more recent - have been added to the World Bank’s global database, bringing the total count of household surveys to over fifteen hundred. Many surveys have also been updated, reflecting corrections and improvements to the data sources. In particular, all the estimates drawn from the Luxembourg Income Study (used for some of the “other high income economies”) have been updated. Finally, a previously unavailable household survey for Haiti included consumption expenditures as an indicator of well-being, whereas previous data was income-based. The use of the consumption data, which always takes precedence in PovcalNet, led to a substantial decline in poverty estimates for Haiti and thus a decline in the extreme poverty rate in Latin America.
Do these changes make a difference to the numbers?
Table 1 compares the 2016 and 2017 versions of the global and regional poverty estimates for 2013, using the International Poverty Line of 1.90/day. Compared to the estimates produced in October 2016, the total number of poor increased by 2.5 million (from 766.0 to 768.5 million), leaving the share of the global population that is considered extremely poor unchanged at 10.7 percent. It is clear from the table that this update does not change our broad conclusions about extreme poverty at the global level. But we believe that these new numbers provide a more accurate and reliable portrait at the country and regional levels, and substantially enhanced coverage, particularly in the Middle East and North Africa, and among the high-income economies that do not borrow from the Bank.


Join the Conversation