As I reported in my last post, Jim Kim’s arrival as World Bank President has reinvigorated the debate about the idea of the World Bank being a ‘knowledge bank’. In the post, I argued that the knowledge produced by the Bank – whether gleaned from its lending operations, or from its research and other analytic work – is a global public good, and that we should therefore assess the success of the institution in its knowledge work not in terms of how specific ‘client’ governments value the outputs of its knowledge work but rather in terms of how people around the world use and value them.
A big data dump
To shed some light on this issue, I started by assembling a list of the 10,000 most downloaded files from Bank’s internet over the period November 1, 2007 - November 14, 2011.
I rather like downloads as a statistic of usage. If someone downloads a file, we can reasonably infer they’re going to take a look at its contents – a download is an indicator of intent to use. Some people may look at a file’s contents and perform a world-changing act as a consequence. Bill Gates did this when he read the 1993 World Development Report (WDR) on health, and was so shocked by the charts and the accompanying text that he set up the Bill and Melinda Gates Foundation. For every Bill Gates there are doubtless hundreds of people who forget to open the file, or do so and then think “Hmm, interesting” but don’t do anything more. Only a few will go on and cite the document in their writings, and only some of them will get published in a journal tracked by Google Scholar. A Google Scholar citation – used by me in an earlier post – is clearly a higher bar than a download.
Downloads have a big disadvantage, though – there may well be a lot of knowledge in a web page that can be read without being downloaded. A reading of a blog post, for example, won’t get captured as a download. I’ll come back to this later.
I’ve deliberately cast my net across the entire World Bank internet. I’m not limiting the search to documents that are downloaded from, say, the Bank’s Documents and Reports (D&R) database or the new Open Knowledge Repository (OKR). Sometimes documents pop up in several places on the Bank’s internet – they may well be in D&R, but it may be that the downloads occur mostly from some other location. That’s often the case with the WDR, which has its own website, and has been the case with one of my own books, where the PDF is also housed on one of the network ‘anchor’s’ websites.
I’m also not yet making any judgment about what a knowledge product is. I’m not saying at this stage that a knowledge product has to be a document falling into a predefined category (there’s a lot of talk right now in the Bank about classifying knowledge products) – or even that it must be a document. As we’ll see in a moment, starting with predefined categories of knowledge products and focusing on ‘approved’ storage locations would lead us badly astray.
What’s in the top-10,000?
This isn’t an easy question to answer, given the way the software the Bank uses is set up. Against each download figure is simply a URL. To figure out exactly what a URL refers to you have to click on it. I must confess I wasn’t that excited about clicking on 10,000 URL’s.
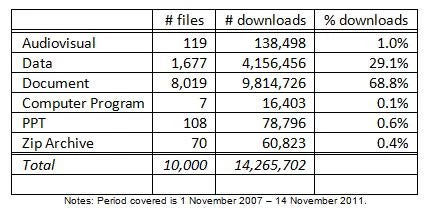
But there are a couple of things I could do fairly easily with the top-10,000 by parsing the URL’s. The first thing I did was to classify by file type. Table 1 shows that as much as 17% of the 10,000 items (accounting for 30% of downloads) are datasets, mostly from the Development Economics (DEC) data group. Datasets to my mind are a knowledge product – and the download figures make it clear they’re highly used. An important part of the ‘knowledge bank’s’ function then is to be a trusted provider of data. There are also 108 Powerpoints that make it into the top-10,000 and 7 computer programs. We might not be convinced they’re all knowledge products – we might agree that a Powerpoint explaining how the Bank’s procurement process works isn’t. We’ll do some digging in a moment to separate knowledge products from other highly downloaded files.
Table 1: What are the different file types in the top-10,000?
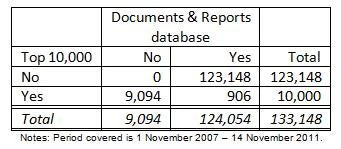
Before we do, take a look at Table 2 which shows the results of the second exercise I did with the top-10,000. What the table shows is that only 906 of the 10,000 most downloaded files were downloaded from D&R. So if we had decided at the start that D&R is the universe of knowledge products, we could have gone badly astray. That’s assuming that a sizeable number of the 9,094 that weren’t downloaded from D&R are indeed knowledge products. Let’s see if they are.
Table 2: How many of the top-10,000 files are in Documents & Reports?
The 200 most downloaded (non-data) knowledge products
While checking the contents of each of the top 10,000 files wasn’t an option, producing a list of – and classifying – the top-200 knowledge products seemed feasible. So that’s what I did.
I started by eliminating the datasets – they’re clearly knowledge products, but let’s leave them for another day. I then went down the remaining files starting at the top, checking first to see if the file still exists, and if so whether its contents could pass as a knowledge product. Many files are no longer available – the International Finance Corporation (IFC) seems to have overhauled its website and, with the exception of Doing Business, I couldn’t find any of the files. Many other files are still available but aren’t knowledge products – the items I discarded included a job vacancy in the Bank’s inspection panel, job application forms, specimen CVs, procurement documents, brochures advertising the World Bank Group’s work, further particulars of the Young Professionals program, country assistance strategies, timetables of the Bank’s executive directors, and so on. I kept going down the list until I got to item # 623 which is the Bank’s 200th most downloaded knowledge product. For each of the top 200 I noted down the details, and classified it. The full list is here.
Before going to the breakdown, it’s worth noting the result above about D&R still holds – only 15 of the 200 most-downloaded knowledge products (8%) were downloaded from D&R. Many aren’t even in D&R, and many of those that are have a PDF version elsewhere on the Bank’s website that people are downloading. This substantially complicates any webmetric-based analysis of World Bank knowledge product use.
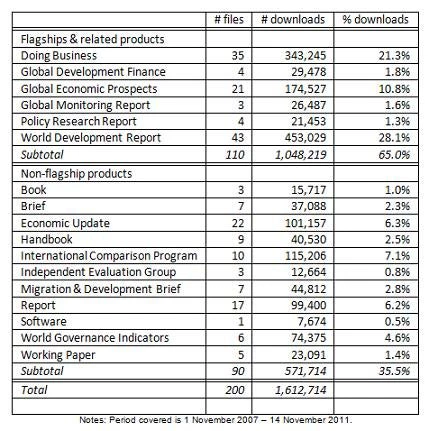
Table 3 shows the breakdown of the 200 most downloaded knowledge products. Just over half are flagship items – sometimes the full report, sometimes the overview, sometimes an annex, in one case just a box! In all, these 109 items had been downloaded over a million times, 64% of the total 1.6 million downloads of the top-200. Most of the big annual flagships stand out. These include the World Development Report (WDR), Doing Business, and Global Economic Prospects (GEP). The annual Global Monitoring Report (GMR) and the now defunct Global Development Finance (GDF) do less well. The high download rates of flagships stand in stark contrast to the low citation rates that Martin Ravallion and I found.
Table 3: Breakdown by product type of 200 most downloaded knowledge products
There are some interesting findings within the various flagships. Downloads of Doing Business and GDF have grown each year, while downloads of the GMR have been declining. Downloads of the WDR show a less clear-cut pattern, as Figure 1 shows. I focused in Figure 1 on files that contained the full text in English – I discarded overviews, individual chapters, boxes, foreign language versions, etc., but I aggregated downloads across multiple versions of the same full-text file. I should also clarify that I included in Fig 1 all WDR’s that made it into the top-10,000. Only those above and including the 1990 WDR on poverty made it into the top-200 – it’s interesting that two from the 1990’s made it into the top-200 downloads between 2007 and 2011.
Figure 1: Downloads of WDR’s over the period 2007-2011

My classification of the non-flagship products could probably be improved, but some interesting findings emerge. Handbooks dominate other books in downloads – the Bank, it seems, has an important role to play in democratizing analytic work on development, a point reinforced by the presence of the computer program ADePT in the top 200 (ranked 17th out of the 91 non-flagship products). Economic updates for specific countries (China and Russia especially) and regions (E Asia especially) are highly used, as are briefs, e.g. on food prices and on migration and remittances – this points to the important role of the Bank not just as a trusted provider of data, but as a trusted interpreter of data.
The popularity of the products of the International Comparison Program (which produced the world’s new purchasing power parity (PPP) values), and those of the world governance indicators, points to the important role the Bank plays in developing new measurement methodologies. Only a few reports and working papers make it into the top-200; those that do are often on highly charged topics like global food prices and India’s malnutrition puzzle. Interestingly, three reports by the Independent Evaluation Group (IEG) make it into the top-200; one is the group’s reassessment of the costs and benefits of rural electrification.
Some caveats
In a way, it’s not altogether surprising that the DEC and IFC flagships dominate other knowledge products in terms of downloads – a vast amount of money goes into their preparation. Recent issues of the WDR have cost $5-6 million a year, with roughly half coming from the Bank’s core administrative budget and the rest coming from donors. This works out at several hundred dollars per download. Other knowledge products cost much less, and many get some rather good download figures. The policy research working paper “Implications of higher global food prices for poverty in low-income countries” was downloaded over 8,000 times between 2007 and 2011. Assuming this cost $100,000 to produce – a wild guess – each download cost just $12. In fact, a lot of policy research working papers get quite respectable downloads. In the top-10,000 there are around 300 of them. Assuming each cost $100,000 to produce, the cost per download for the least downloaded working paper was $279. My guess is that a lot of the other knowledge products – especially East Asia’s economic updates – also look like a bargain seen in this light!
Another caveat is what I mentioned earlier – not every document needs to be downloaded to be read. Blog posts, for example, don’t. As I showed in another post, a lot of blog posts get very high page views. The most read blog post of 2011 (“Can rapid population growth be good for economic development?”, published in April 2010) got nearly 21,000 views over the period November 2011 - November 2011. This compares rather favorably with the 2010 WDR’s download figure of 35,000 (for the period 2007-2011). Blog posts don’t have anything like the depth of a WDR, of course, or even of a working paper. But some – including several on the Development Impact blog – contain material that subsequently becomes the basis of a working paper which then becomes a journal article. And blog posts are a great medium for getting across small, medium and even large ideas in a few words. Who’s to say that – if blog posts had been a medium at the time – Bill Gates wouldn’t have been equally moved by a well written blog post as he was by the 1993 WDR?

Join the Conversation