Good principals can make a big difference
“It is widely believed that a good principal is the key to a successful school.” So say Branch, Hanushek, and Rivkin in their study of school principals on learning productivity. But how do you measure this? Using a database from Texas in the United States, they employ a value-added approach analogous to that used to measure performance among teachers. They control for basic information on student backgrounds (gender, ethnicity, and an indicator of poverty) as well as student test scores from the previous year. Then they ask, What happens to student learning when a school changes principals? They find that increasing principal quality by one standard deviation increases student learning by 0.11 standard deviations. Even after additional adjustments, their most conservative estimates show that “a 1-standard-deviation increase in principal quality translates into roughly 0.05 standard deviations in average student achievement gains, or nearly two months of additional learning.”
Notably, while improving teacher effectiveness affects the average performance of all of the students in his class, improving principal effectiveness affects average performance of the entire school, so the potential gains are high.
Not all schools have good principals
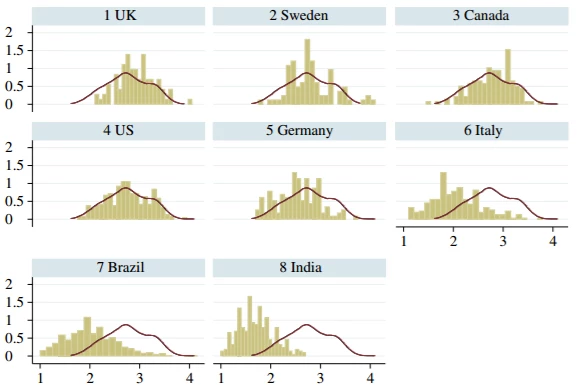
Across countries, the quality of management in schools varies dramatically. Bloom and others measure management quality in 1,800 secondary schools across 8 countries, using a version of the World Management Survey adapted for schools. As the graph below shows, the distribution of management scores varies both within and across countries, with a lot of poorly managed schools. As one scholar recently opined on U.S. schools, “School principals by and large are middle managers rather than full-fledged institutional leaders.”
Source and notes: Bloom and others 2015. The red lines are the distribution of management in U.S. schools (for comparison purposes). The bars show the distribution of management scores in each country. Better management scores are to the right.
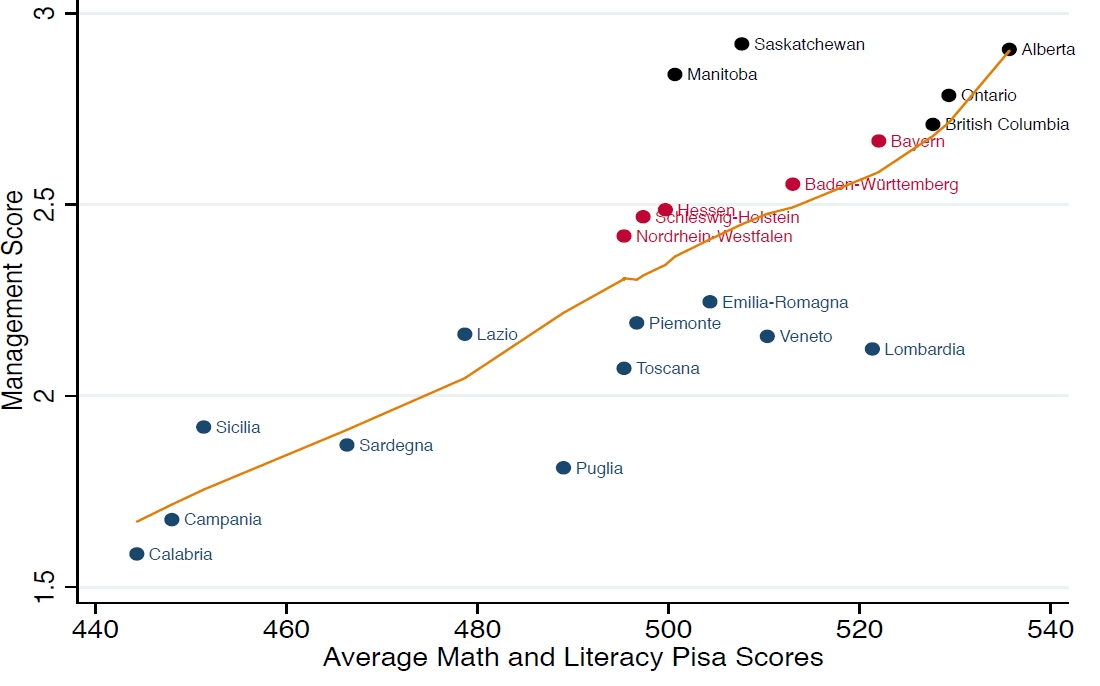
When those management scores are linked with student performance, the association is stark.
Source and notes: Fryer 2017. Regional data are from within Canada, Germany, and Italy.
Can school principals get better?
While a sizeable literature has examined “school-based management” interventions, most of those focus on getting the community more involved in school decisions rather than improving the quality of the principal’s leadership or management. So Roland Fryer’s new working paper on the impact of training school principals is welcome. As he puts it, “To date, all evidence on the relationship between school management and student achievement has been correlational.”
Back to Texas. Of 58 schools, half received intensive principal management training. (The schools were randomized using matched pairs and were roughly evenly distributed between primary, lower secondary, and upper secondary schools. They were matched by level and by pre-treatment test scores.) The training involved 300 hours of training over two years. That included a one-week training each summer, ongoing coaching from a trainer (the “Chief Management Officer”), a set of high-quality interim assessments and training in how to use them, and a data monitoring system.
As ultimately implemented, the intervention involved three management levers. Each lever has an element of content and an element of systems: Give principals better content to share with their teachers, and give them a system to do it.
Lever 1: Instructional Planning
Each week, teachers were supposed to turn in lesson plans, and principals were to give feedback. Principals received training in “how to provide high-quality feedback on teacher lesson plans and how to lead a planning meeting with teachers” as well as in the process of “backward planning.” Many teachers engage in “activity-based planning,” where they come up with an engaging activity on the topic of instruction (Fryer gives the example of building a model volcano for a unit on volcanoes) and then decide what to assess based on the activity. “Backward planning” starts from what teachers want to assess and works backwards to design activities that will generate that knowledge.
Lever 2: Data-driven Instruction
Students were assessed every 6-8 weeks in reading, math, science, and social studies. (In practice, schools administered more than 90 percent of the assessments.) After each assessment, the data were uploaded to a data analysis platform, and teachers were to analyze the data and draft action plans within one week of the assessment. Principals (or other school leaders) would then meet with teachers to give feedback on the plans. Completion of the action plans was less consistent: 75 percent of treatment schools submitted at least one action plan during the year. School were also encouraged to carry out weekly formative assessments (short quizzes), but those were not monitored. Control schools also had access to the assessments but not the training in how to incorporate them into action plans.
Lever 3: Observation and feedback
“Principals were expected to ensure that all teachers were observed during classroom instruction at least once every other week for 15-20 minutes per observation,” either by the principal or another school leader. The observer and the teacher then met to discuss and “identify at least one key action step for the teacher to implement in order to improve instruction.” Principals and school leaders were trained in how to observe, how to conduct the follow-up meetings, and how to track the observations. The follow-up meetings followed a 6-step protocol from Patrick Bambrick-Santoyo’s Leverage Leadership. Many simply used Google spreadsheet to track observations.
Results
Principals who were offered the treatment participated in 58 percent of the trainings (versus 1 percent of control principals). Teachers in treatment schools were observed – on average – 0.6 times per month according to administrative data, i.e., just over once every two months (versus 0.04 times per month in control schools, or once in 25 months). The difference is smaller in principal-reported data: 2.3 observations per teacher per month for treatment versus 1.3 for control. At the end of the first year, 80 percent of principals in treatment schools rated their training was more effective than the previous year (i.e., business-as-usual training), more than 3 times the number in control schools.
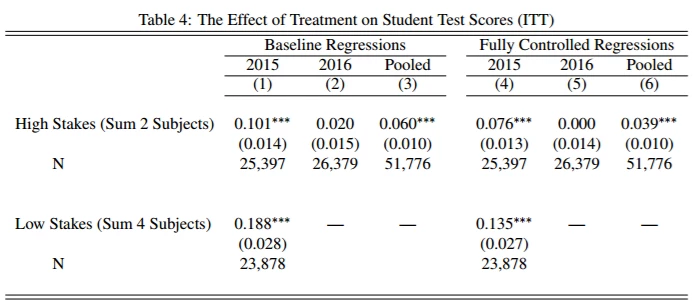
What about student learning? Fryer examines impacts on both low and high stakes tests in the first year and then on high stakes tests for the second year. (The district phased out the standardized low stakes tests to reduce the total testing days.) As you can see from the table below, the program had an impact, particularly in its first year, with just the offer of training delivering about 1 standard deviation in learning.
Source: Fryer 2017. The “baseline regressions” do not include controls. The “fully controlled regressions” do. The results are in standard deviations.
The program worked better for some principals than for others: It worked better for principals with graduate degrees, for principals with higher test scores of their own (on the SAT), higher socioemotional measures (grit and internal locus of control).
Some of the largest effects are observed in schools where the same principal remained for the two years of the program, with a 0.13 standard deviation gain on the high-stakes test and a 0.32 gain on the low-stakes test. Likewise, there is a steep gradient on implementation: Principals who implement the program with more fidelity see much bigger impacts. Of course, implementation is endogenous, but even if you predict implementation using pre-intervention principal characteristics, the gradient is clearly positive. Fryer goes on to implement a range of robustness checks, including multiple hypothesis corrections, which I will leave to your bedtime reading.
Cost-effectiveness
Fryer then compares the effect sizes and costs to a range of other educational interventions in the United States. Here’s what he finds:
- “The effect of lowering class sizes from 24 to 16 students per teacher is approximately 0.24 standard deviations per year on summed math and reading test scores, with a marginal cost of $5,084 per student and an IRR of 9.7% (Krueger 1999).”
- “The Harlem Children’s Zone Promise Academy Middle School increases summed math and reading test scores by 0.28s per year, with a marginal cost of $7,536 and an IRR of 11.9% (Dobbie and Fryer 2011).”
- “Teach for America increases summed math and reading scores by 0.18s per year, with a marginal cost of $3,707 and an IRR of 11.7% (Glazerman et al. 2006).”
- “The average marginal cost per pupil of our experiment is $9.26 per student, per year…. This implies an IRR of 79% – the highest among all those calculated using experimental data. Moreover, if school districts can target the management training to principals who, a priori, are likely to remain in their jobs for the duration of the training or implement the training with high fidelity, the IRR is 94% or 96%, respectively.”
School principals can become better. But this example is an intensive, multi-pronged intervention, and the quality of implementation made a big difference. So let’s make our principals better, but don’t expect it to be easy.
Bonus reading
- Branch and others’ 2013 study in Education Next (cited above) is based on this longer NBER Working Paper from 2012.
- Fryer has an appendix which describes the program in great detail.

Join the Conversation