 World Bank
Zimbabwe saw a significant improvement in the quality of life in several dimensions in the 2010s. Fewer children died within their first year of birth, fewer children under the age of five were malnourished, more adults were literate, and more young children were engaged in early childhood learning. These outcomes were better in Zimbabwe than in the rest of sub-Saharan Africa. The average child born in Zimbabwe in 2019 is expected to have a higher endowment of human capital at the age of 18 than his/her peers born even in some of Zimbabwe's richer neighbors. Access to basic infrastructure services, such as clean drinking water, sanitation, and electricity also improved over this period.
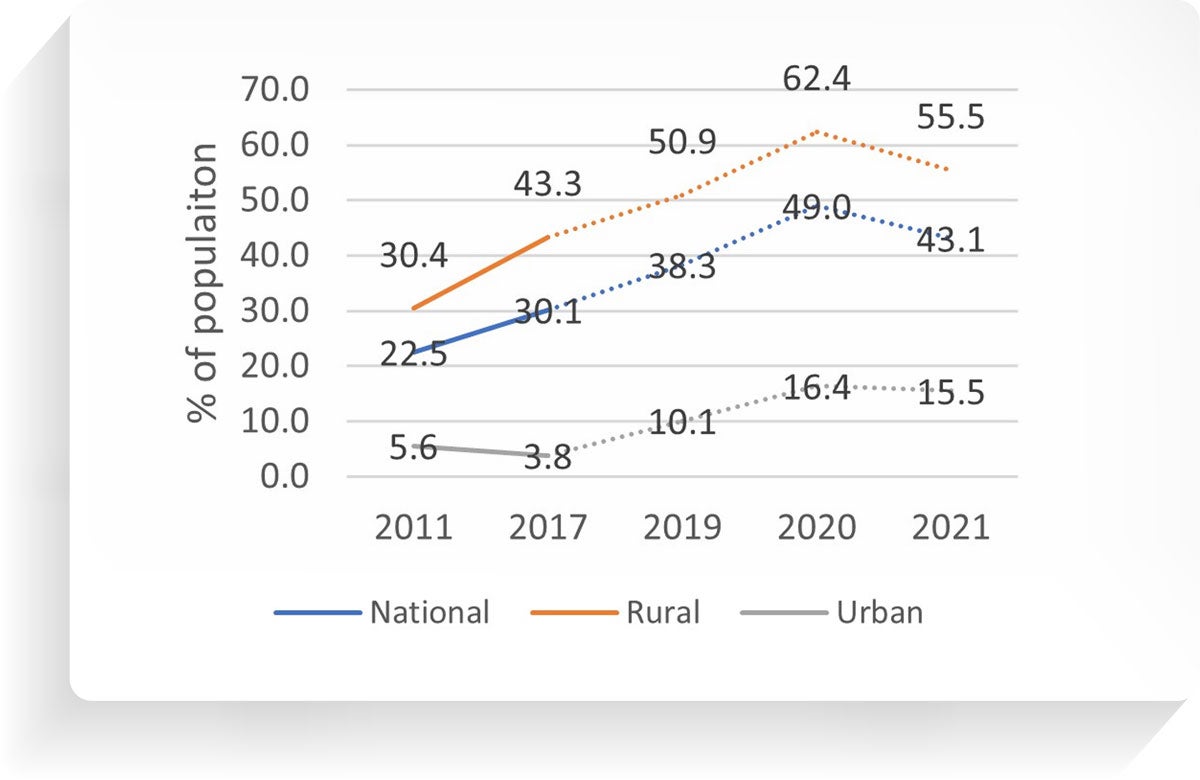
Yet, the food poverty rate increased steadily in the 2010s, starting at 23% in 2011, climbing to 30% in 2017 and 38% in 2019, and reaching its peak of 49% in July 2020, soon after the onset of the COVID-19 pandemic. The food poverty rate fell by 6 percentage points to 43% in 2021 on the backs of economic recovery and record maize harvests (Figure1). This is far from Zimbabwe’s aspiration to reduce the share of the population below the food poverty line to 10% percent by 2025.
These are among the topline findings of the Zimbabwe Poverty Assessment, launched today. Its objectives are to take stock of the recent trend in poverty and inequality, sketch a profile of the poor, explore the main drivers of poverty, and build an evidence base for policies to help foster inclusive growth. The primary data used in the analysis are the official household data collected by ZIMSTAT through the Poverty, Income, Consumption, and Expenditure Surveys (PICES) in 2011, 2017, 2019, and household monitoring phone surveys (Rapid-PICES) conducted after the pandemic, some of which were funded by the World Bank’s Zimbabwe Reconstruction Fund.
As poverty increased, so did inequality, with the Gini index rising from 42 in 2011 to 50 in 2019. Thus, many Zimbabweans not only saw their living standards deteriorate over the decade, but they also witnessed the gulf between poorer and richer in the population widen.
Figure 1: Poverty headcount ratio, national food poverty line, 2011-2021
Note: The poverty estimates for 2019, 2020, and 2021 denoted by dotted lines are based on survey-to-survey imputation.
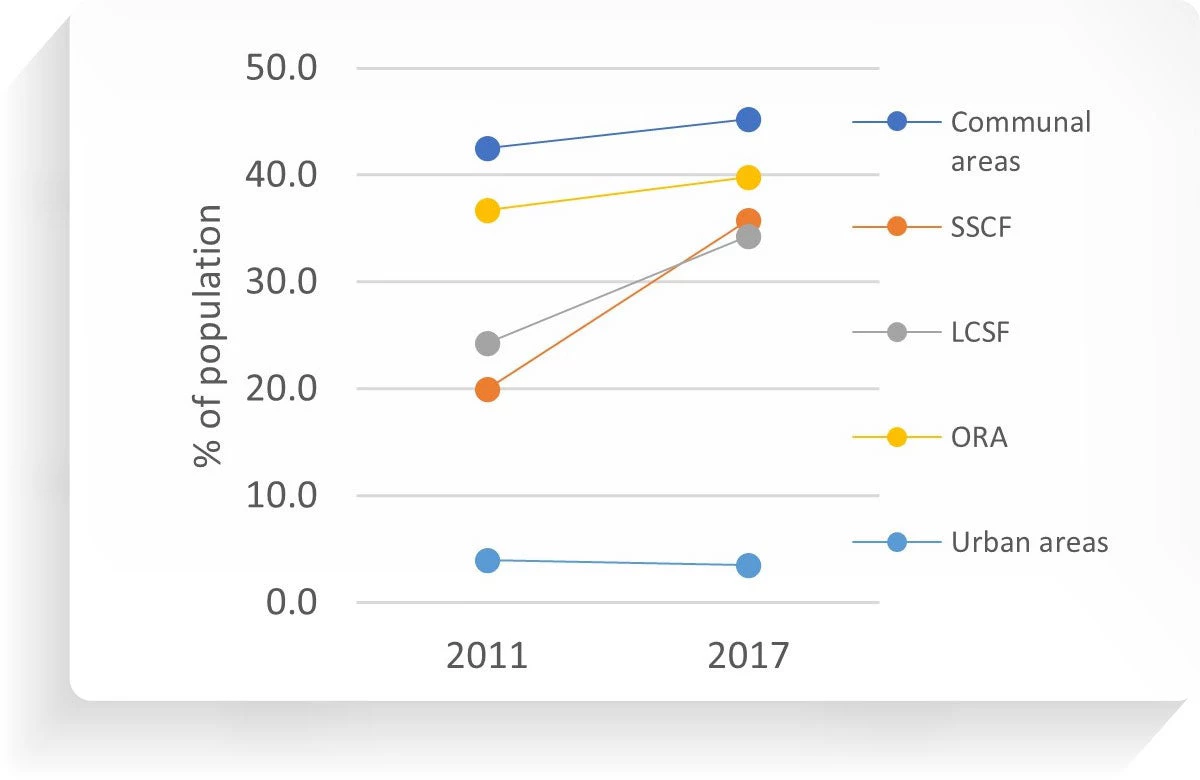
The conclusion: There is a large disparity in food poverty across geographic and socioeconomic groups. Food poverty in Zimbabwe is mainly rural and agrarian. Rural areas are four to five times poorer than urban areas, accounting for about 90% of the poor. Communal areas are at a particular disadvantage, with the food poverty rate more than 10 times that in urban areas.
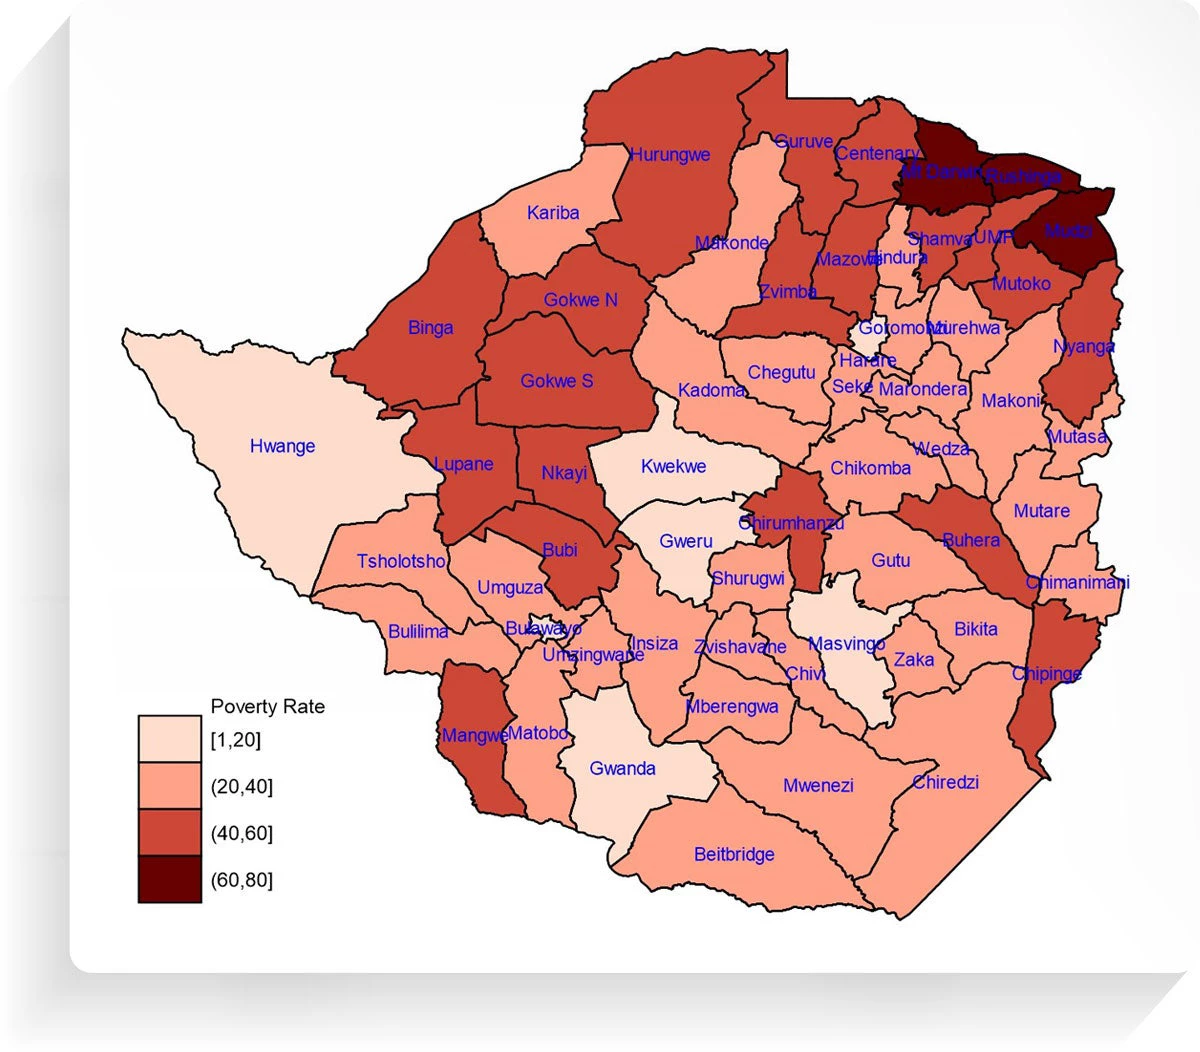
The differences are accentuated at smaller administrative levels. The least poor district in 2017 had about 1% of its residents living in food poverty, while the poorest district had more than 60% . Households whose head has secondary education (at least) or were employed in industry or services are less poor, compared to households whose head has less than secondary education or works in agriculture.
Figure 2: Spatial differences in poverty
a. Poverty headcount by settlement areas, 2011-2017
b. Poverty headcount by district, 2017
So why has poverty increased?
- Droughts. The most drought-prone wards of the country experience drought on average every two to three years. Even in humid areas in the Eastern Highlands and the Central Highveld, droughts occur about once every five to six years. Access to irrigation remains limited, with less than 1% of total cultivated land under irrigation. As a result, net farm revenues in the smallholder farming sector are much more sensitive to temperature and precipitation in rainfed farms compared to irrigated farms. Zimbabwean smallholder farmers also face other risks—flooding, pests, diseases, and predation. As the climate changes, extreme weather events are predicted to become more frequent, increasing the risk to vulnerable households. Without well-developed financial markets, such losses are not insured, so households must absorb the loss or engage in costly ex-post coping mechanisms.
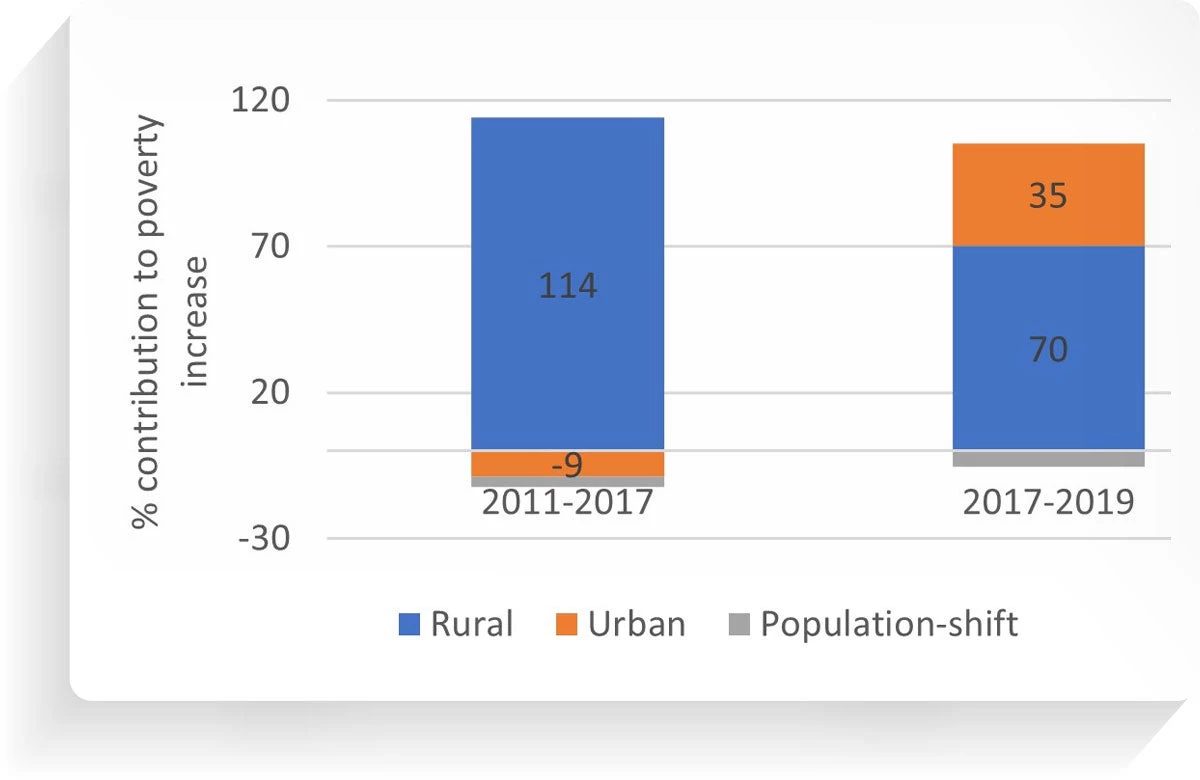
- Inflation: After staying low and stable for much of the 2010s, prices jumped sharply in 2018, with the increase in food prices outpacing the increase in general prices. Urban households buy a much higher share of their total food consumption, so they are more affected by food price inflation. Indeed, the relative contribution of urban areas to the total increase in poverty was higher in 2017-2019 than in 2011-2017 (Figure 3).
- Pandemic: The economy went into a recession in 2019, reflecting the impact of a poor harvest and also of power shortages caused by record drought. The situation was exacerbated in 2020 by the pandemic, leading to another recession that pushed many people into unemployment and poverty.
- Policy choices: Macroeconomic challenges have been impediments to economic growth, structural transformation, private sector development, jobs creation, poverty reduction, and service delivery. An often expansionary fiscal and monetary stance has contributed to high inflation. Zimbabwe’s inability to access international capital due to external arrears has led to domestic liquidity shortages, impacting private sector activities, and stifling employment. Paying the large civil service, support to agriculture, and subsidizing inefficient public enterprises has diverted resources that could have been spent on social sectors, such as health, education, and social protection.
Figure 3: Contribution to poverty change, 2011-2017 and 2017-2019
What does our assessment recommend?
In short: Expanding access to irrigated agriculture, the use of modern inputs, climate-smart farming , extension services, diversification to high-value crops, and market orientation of smallholder farmers are all needed to boost agricultural productivity. With Zimbabwe predicted to get hotter and drier, adaptation measures are important to shield smallholder farmers.
A fundamental transition of the economy is required from a rural, low-productivity agriculture to higher-productivity activities in industry and services concentrated in urban areas. Zimbabwe has a promising endowment of human capital. To maximize its returns, promoting the entry and growth of firms for the creation of productive jobs should be a priority. Policies for orderly, equitable urbanization need to help people access high-paying jobs in non-agricultural sectors.
The social assistance programs are pro-poor, and there are opportunities to improve their efficiency, even without additional fiscal commitment, through better targeting. But increasing coverage and transfer size—which imply more fiscal commitment—is equally important to make a significant dent in poverty and equity. There is also room to improve the shock-responsiveness of the system.
Finally, as we say in our recently released Country Economic Memorandum, policy consistency and macroeconomic stability through fiscal discipline, tight monetary policy, and effective exchange rate management are necessary to promote private sector investment and growth in productivity. They are the prerequisites to the structural transformation of livelihoods, inclusive growth, and sustained poverty reduction.


Join the Conversation