 Bank resolution illustration. | shutterstock.com
The creation of designated financial institutions to purchase and resolve nonperforming loans (NPLs) from banks is referred to as the “bad bank” model of troubled asset resolution. It has been viewed by policy makers as a viable method to resolve distressed banking assets (e.g., Geithner, 2009). Such a model has been used to resolve financial crises since the 1980s in China, France, Germany, Spain, Sweden, and the United States. Most recently, in February 2021, the Indian government proposed a bad bank structure in its Budget 2021.1
However, despite the buy-in of various policy makers, systematic study of the efficiency of the bad bank model has been scarce due to the lack of transaction-level data. In a recent research study, we use China as a setting to analyze the empirical performance of bad banks in resolving NPLs.
Binding Financial Regulation, Opaque Transactions, and Distorted Incentives
Starting in 2012, the Chinese government has allowed local asset management companies (AMCs) as designated financial institutions to acquire NPLs from banks, explicitly stating that local AMCs should conduct transactions “in accordance with the principle of market economy.”
The Chinese Banking and Insurance Regulatory Commission enforces regulatory minimums on the loan loss allowances relative to NPLs and the loan loss allowances relative to total loans; both requirements appear binding in the data as banks cluster just above their respective thresholds. Selling NPLs to AMCs allows banks to remove NPLs and generates more slack in satisfying the regulatory ratios.
As distressed debt resolution specialists, local AMCs are tasked with assuming the credit risks of the NPLs from banks and resolving NPLs outside the banking sector. We analyze detailed transaction-level data from a leading local AMC and document five revealing facts:
- The mean and median haircut on NPL transactions in our data are only 5.1% and 0%, respectively, despite the average NPL package being over 4.5 years delinquent.2 The haircut decreases with delinquency and increases with bank capitalization.
- All NPL transaction contracts feature a collection delegation clause whereby the AMC delegates the obligation to collect on the NPLs back to the banks.
- Banks finance over 90% of the NPL transactions through direct loans to the AMC or indirect financing vehicles. Following a regulatory ruling in July 2019 that explicitly banned direct loans from banks to AMCs to finance the NPL purchases, direct loans ceased to exist, but 88% of transactions remain financed by banks through indirect financing vehicles.
- AMCs resell almost three-quarters of the NPLs to third parties who are in the same cities as the banks and are borrowers of the banks. Resale prices are always at a premium relative to purchase prices, regardless of loan quality. The longer an NPL package stays with the AMC, the higher is the resale price.
- Public financial markets do not respond to the NPL transactions.
Collectively, these results are more consistent with NPL transactions concealing rather than resolving troubled bank assets. Three parties are involved in the concealment process: (1) banks, which want to remove NPLs from their balance sheets to comply with the quantity-based loan quality regulation; (2) AMCs, which are compensated for acting as pass-through entities; and (3) third-party bank affiliates, which are the ultimate owners of the NPLs and borrowers of the bank.
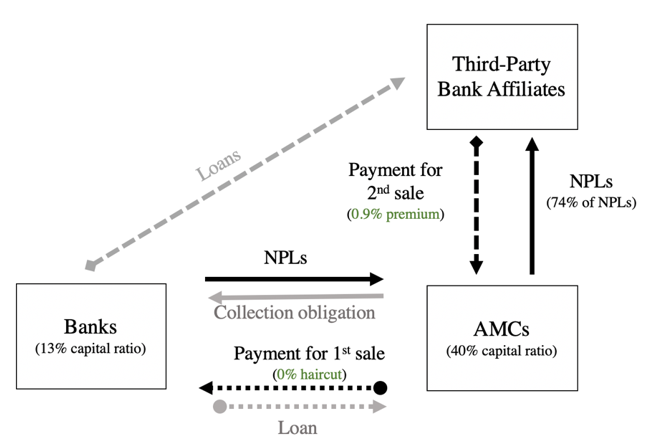
Figure 1: Movement of NPLs in the Financial System
Because banks still remain exposed to those transacted NPLs in the process above, we call the transferred loans “hidden NPLs.” Although they are removed from bank balance sheets, the banks are still liable for their losses.
Implications for China’s Banking System and International Financial Regulators
NPLs can weaken bank health and curtail bank credit supply, leading to systemic financial crises and real economic disruptions. Jiménez et al. (2017) argue that high NPLs impede bank response to countercyclical capital buffers due to binding market constraints. According to our analysis, recognizing the hidden NPLs implies that total NPLs in China is two to four times the reported amount (total between US$600 billion and US$1.2 trillion compared with the reported US$300 billion).
Overall, these results are broadly consistent with the existing research documenting strategic behaviors of banks to reduce regulatory burden. For example, Acharya, Schnabl, and Suarez (2013) document that prior to the financial crisis in 2008, banks in the United States securitized assets without transferring risks in a way that reduced regulatory capital requirements. Begley, Purnanandam, and Zheng (2017) study a sample of large banks globally and find that they appear to be strategically underreporting risks in their trading books to avoid capital surcharges.
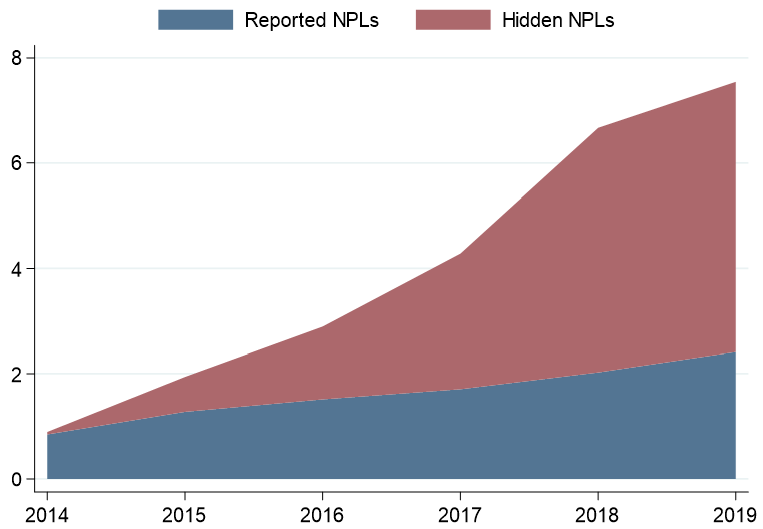
Figure 2: Magnitude of Hidden NPLs
Beyond the Chinese context, our findings have implications for the design of problem loan resolution. In the presence of binding financial regulations and opaque market structures, the bad bank model with little oversight on NPL transactions can incentivize banks to devise transactions to simply hide their troubled assets without proper resolution. Requiring banks to adhere to strict financial regulations can hamper the effectiveness of the “bad bank” model to resolve NPLs as the regulations can generate distorted incentives whereby banks find it more beneficial to conceal loans in the short term rather than resolve them at a loss.
References
Acharya, Viral V, Philipp Schnabl, and Gustavo Suarez. 2013. “Securitization without Risk Transfer.” Journal of Financial Economics 107 (3): 515–36.
Begley, Taylor A., Amiyatosh K. Purnanandam, and Kuncheng Zheng. 2017. “The Strategic Underreporting of Bank Risk.” Review of Financial Studies 30 (10).
Geithner, T. 2009. My Plan for Bad Bank Assets.
Jiménez, Gabriel, Steven Ongena, José Luis Peydró, and Jesús Saurina. 2017. “Macroprudential Policy, Countercyclical Bank Capital Buffers, and Credit Supply: Evidence from the Spanish Dynamic Provisioning Experiments.” Journal of Political Economy 125 (6): 2126–77.
McMahon, D. 2019. Taobao Bad Loan Auctions: What Online Prices Reveal About the NPL Market. Marco Polo, 1–9.
__________________________________
1 https://www.bloombergquint.com/business/budget-2021-india-plans-a-bad-bank-like-structure-to-resolve-npas.
2 In contrast, the average haircuts observed in Taobao NPL auctions open to the public are between 20% and 60% (McMahon 2019).


Join the Conversation