 Man engaged in the stock market | © shutterstock.com
Everyone should invest in stocks, at least a very small fraction of their wealth. This suggestion is probably one of the few consensuses that business school professors and economists share. Without digging into sophisticated economic models, one could easily see why by checking some stats. The average annual return in the US stock market in the past 90 years is as high as 7.8%, much higher than the interest rate on savings accounts and the 3-month Treasury bill rate. Even if one is extremely risk-averse, she could still invest a relatively small portion of her wealth to enjoy the high equity premium. To researchers’ surprise, there is a substantial number of households who do not participate in the stock market at all. What is even more striking is that this nonparticipation exists across all income levels and is widely documented in various countries. Nonparticipation in the stock market not only deteriorates households’ financial condition, but also could lead to greater income inequality and lower economic output in our society. It is in researchers’ own interest and for the sake of public interest to study the motives for why (and why not) households invest in the stock market.
In a new paper, I study the word-of-mouth channel to see if your friend’s stock market participation decision affects your own participation decision. This is possible since not everyone understands the benefit of stock investments. One could learn the facts if her friend shares the positive investment experience with her. Although I do not have data on the stock holding information of all citizens in a country, we could still study aggregated data and utilize the cross-sectional differences in stock market participation rates across regions.
Figure 1: Direct stock market participation rates across US counties in 2018
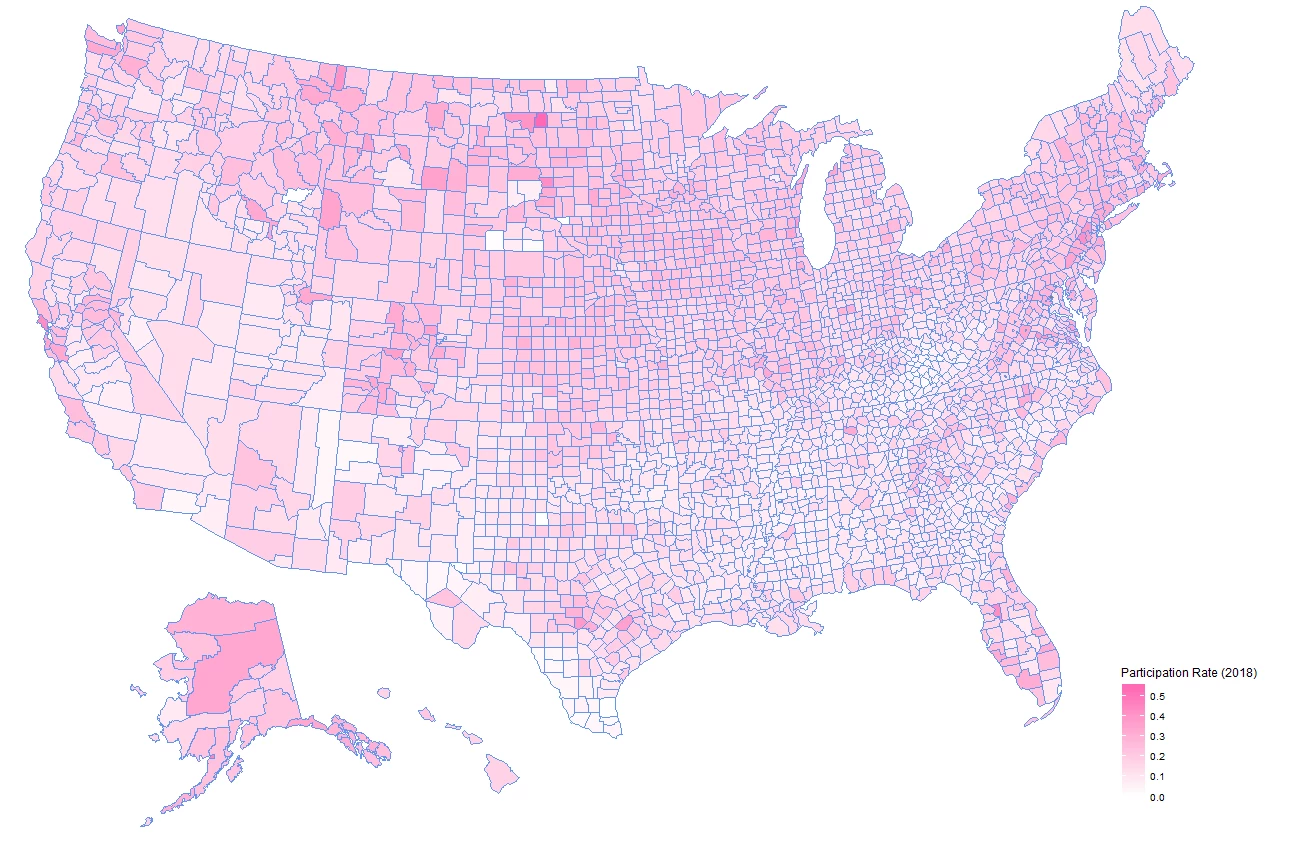
Figure 1 shows the direct stock market participation rates in US counties in 2018. I explore the IRS Statistics of Income data to obtain county-level aggregated tax return data and estimate direct stock market participation rates as the ratio of tax filers with dividend taxes over the total number of tax filers.1 The wide cross-sectional difference in participation rates across counties hints that there exist unobservable determinants of households’ participation decision for researchers to investigate.
I combine the county-level participation rates with the Facebook Social Connectedness Index (SCI) data. The Facebook SCI shows how strongly any random county pairs in the United States are connected. Facebook constructs the SCI data by using Facebook user friendship links across regions. The higher the index is, the two counties are socially more connected. I then build the main explanatory variable in my paper, Friends’ Participation. For each county in each year, its Friends’ Participation is calculated as SCI-value-weighted participation rates in the same year from all other counties in the United States. To avoid any spillover effects due to geographic nearness, I exclude the participation rates from the same state when constructing Friends’ Participation.2
I find that Friends’ Participation positively and statistically significantly predicts the focal county’s stock market participation rates in the following year. After controlling for demographic effects, including population, income level, education, local economic conditions, local stock performance, as well as long-term trends and common shocks shared within the same state, a one percentage point increase in Friends’ Participation leads to an increase of about 25 basis points in the focal county’s participation rate in the next year. Economically, this means that, other things equal, a one standard deviation increase in Friends’ Participation induces more than 40 previously nonparticipants to start investing in the stock market in an average county of 50,000 population.
We all know that correlation does not imply causality. The identified association between friend counties’ participation decision may simply reflect how similar friend counties are. Therefore, to provide an even clearer picture behind this word-of-mouth channel, we need some exogenous shock that only affects certain counties’ participation decision and then examine if this local shock transmits to other connected counties.
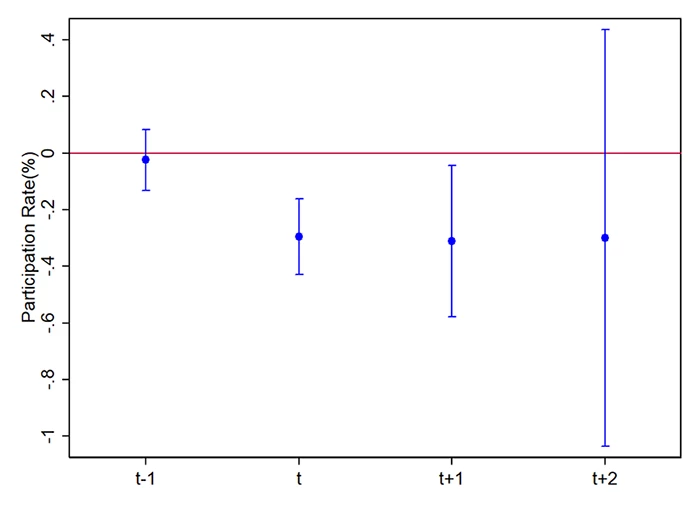
The shock I utilize is financial fraud revelation. FINRA requires financial advisory firms to report misconduct events by their employees every year. I estimate the number of financial misconducts revealed every year in every county and find that one misconduct revelation in 1,000 population decreases the market participation rate by about 30 basis points in the following two years. Economically, this means that upon one financial misconduct event being revealed among 1,000 people, three previously stock market participants would be scared away and decide not to invest in the stock market anymore. This shock has no effect before the revelation, and most of these reports that FINRA collects are very local and would not be broadcasted nationwide. Thus, the revelation of financial misconduct qualifies as the exogenous shock in my study. After instrumenting Friends’ Participation using financial misconduct revelations, the results still hold, suggesting that the relationship between Friends’ Participation (in the previous year) and the focal county’s stock market participation decision is likely to be causal.
Figure 2: Local participation response to revelation of financial misconduc
Policy Implication
The study of why (and why not) people participation in the stock market is of first-order importance in finance research. In this paper, I combine two novel data sets and show that the stock market participation decision in socially-connected counties could affect the focal county’s stock market participation decision . This finding suggests that the low participation rates, especially among low-income households, could be attributed to low financial literacy or lack of awareness of the financial market. By promoting higher financial literacy, policy makers may attain higher stock market participation rates among all income levels and eventually ameliorate income inequality.
1 Readers could find details why this estimation is a nice proxy for stock market participation rates in section 2.2 “What does the IRS participation rate capture?” in my paper.
2 In section 3.3 “The effects from geographic and socially connected friends” in my paper, I show that the influence of geographically close counties exhibits even stronger effects.

Join the Conversation