 Container Ship at the Chittagong Port. | © shutterstock.com
"...buyers do not allow any `Made in Bangladesh' label on the [garment] product ...they [requested] label these very products as 'Made in India' ... "
— Prabir De, "Non-Tariff Measure Study: Bangladesh, India and Nepal," 2016
"Five individuals and two domestic honey-processing companies have been charged with federal crimes... The charges assert that the Chinese-origin honey was mis-declared as other commodities upon importation into the United States and trans-shipped through other countries to evade anti-dumping duties."
— World Customs Organization, Illicit Trade Report, 2012
"Professional Fraud Facilitators... provide a complete fraud package to EU importers and Chinese exporters, with delivery of goods to EU port, change of container in transit country and documented new origin for goods (new B/L, invoices, origin certificates)."
— European Anti-Fraud Office, Customs Origin Fraud and Professional Fraud Facilitators, 2014
In international trade a striking phenomenon often occurs — importing and exporting countries record significantly different customs statistics for the same shipments. This results in notable discrepancies, where import figures are frequently much larger than export figures. A classic example of this is observed in the 2018 trade data between the US and China. The US recorded US$563 billion in overall imports from China, while China recorded US$480 billion in exports to the US. This discrepancy of nearly US$83 billion, or 15 percent, is not just puzzling, but also distorts the actual trade scenario, potentially leading to public misperceptions and misguided policy decisions. Figure 1 presents the distribution of trade discrepancies for a sample of more than 40 importing countries. At the sample mean, the trade discrepancy is about 85 percent — suggesting that most import records are much larger than the export records, for both quantity and value.
What could cause such discrepancies in the official trade statistics? Research suggests several factors:
- Valuation Methods: Different customs agencies may use varied valuation methods. Typically, import values include freight and insurance costs, while export values do not, contributing to discrepancies (Hummels and Lugovskyy,2006).
- Transshipment and Re-Exports: The re-routing of products through third countries often leads to a mismatch in the recorded country of origin (Ferrantino and Wang, 2008).
- Trade Fraud: The discrepancies could also result from trade fraud, where firms may undervalue imports in order to evade import tariffs (Bhagwati,1964; Fisman and Wei, 2004; Javorcik and Narciso, 2008), or undervalue exports to dodge export taxes or VAT (Ferrantino, Liu and Wang, 2012).
In fact, scrutinizing trade discrepancies is increasingly used to detect tariff evasion, especially by the customs authorities of developing countries (Cantens, 2015; Grigoriou, Kalizinje and Raballand, 2019; Grigoriou, 2019; Chalendard, Fernandes, Raballand and Rijkers, 2020).
Figure 1: Sample Distribution of Trade Discrepancies
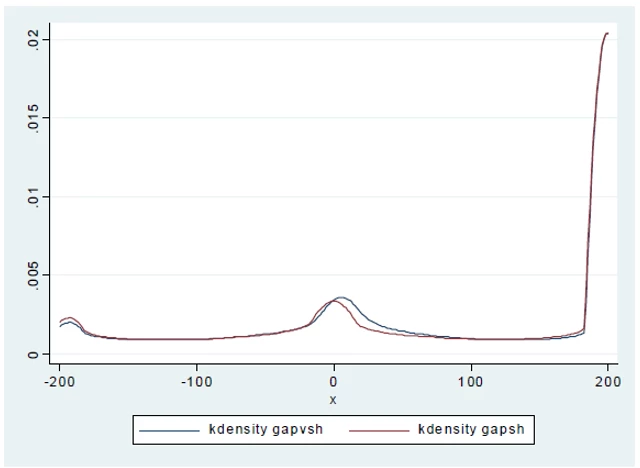
Notes: Trade discrepancies are defined as the percentage difference between the importer's and exporter's statistics. This figure plots the distributions of the value discrepancies (gapvsh) and quantity discrepancies (gapsh) at the HS 6-digit product level across countries. Please refer to Kee and Nicita (2022) for the list of importing countries.
A study by Kee and Nicita (2022) examines whether discrepancies observed in the official trade statistics of importing and exporting countries are partly attributable to trade fraud from evading restrictive border non-tariff measures (NTMs), similar to tariffs. The paper introduces a theoretical model and presents empirical evidence suggesting an increase in discrepancies with higher ad valorem equivalents of NTMs. This trend aligns with the hypothesis of intentional misdeclaration by traders to evade border NTMs. The findings are predominantly relevant to homogeneous products and trade between developed and developing countries.
Database Insights: NTMs and Tariffs
Database of Ad Valorem Equivalent of NTM (DAVE-NTM) presents the data and estimates of Kee and Nicita (2022), and It is accessible at the website: http://www.worldbank.org/dave-ntm
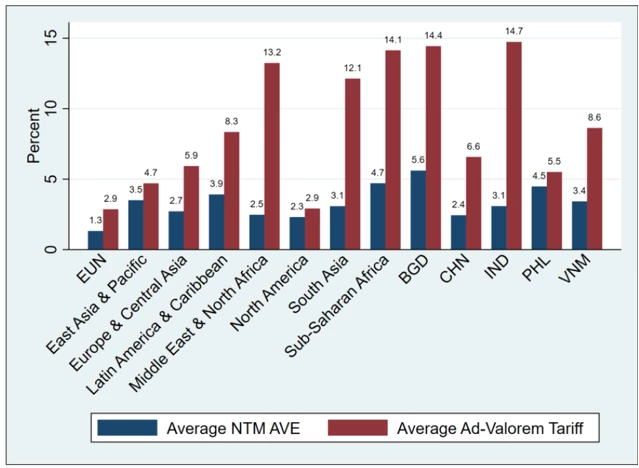
Figure 2 presents the shares of imports faced NTMs in the database across many countries, ranging from less than 40% in South Asia to nearly 90% in North America. Figure 3 presents the ad valorem equivalents of NTMs and tariffs, illustrating that tariffs are generally more restrictive than NTMs in most countries.
In conclusion, discrepancies in trade statistics are not merely statistical anomalies; they often signal underlying issues like trade fraud, particularly in the evasion of NTMs. These discrepancies are more pronounced in the trade between developed and developing countries, and in transactions involving homogeneous goods.
Understanding and addressing these discrepancies is crucial for forming accurate trade policies and maintaining fair international trade practices.
Figure 2: Share of Imports facing NTMs
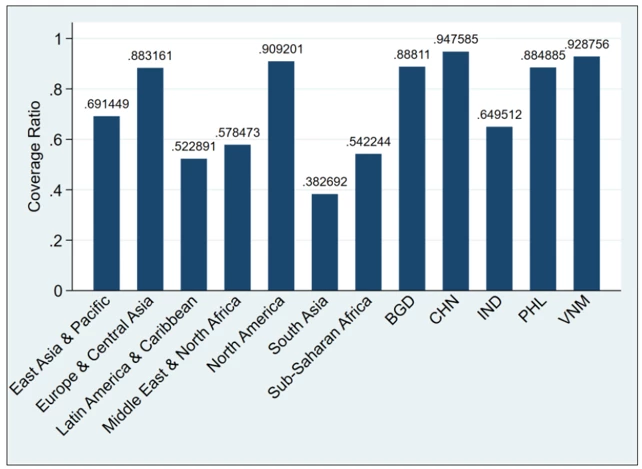
Source: Kee and Nicita (forthcoming).
Figure 3: NTMs vs Tariffs

Join the Conversation