A cyclical growth recovery in Latin America and the Caribbean began in 2017. The upturn in regional growth, from -1.5 percent in 2016 to 0.9 percent in 2017, reflects broadly improving conditions in Brazil, which emerged from a deep, two-year-long recession in the first half of the year, and in Argentina, where growth rebounded after contracting in 2016. The outlook for accelerating regional growth is supported by strengthening private consumption and investment, particularly in commodity exporting countries. Domestic demand is expected to respond favorably to strengthening confidence, relatively low inflation, and global financing conditions that, while somewhat tighter, are still supportive.
Real activity indicators in Brazil improved markedly in 2017
Brazil’s recovery is expected to solidify in 2018. The economy is anticipated to grow 2 percent as improving labor conditions and low inflation support private consumption, and as policy conditions become more supportive of investment.
Sources: Haver Analytics, World Bank.
Sources: Haver Analytics, World Bank.
Accelerating private consumption and investment will lift regional growth in 2018 and 2019
Regional growth is projected to gain momentum in the next two years, rising to 2 percent in 2018 and 2.6 percent in 2019. The growth acceleration is anticipated to be supported predominantly by strengthening private consumption and, to a lesser degree, by investment.
Components of Regional Growth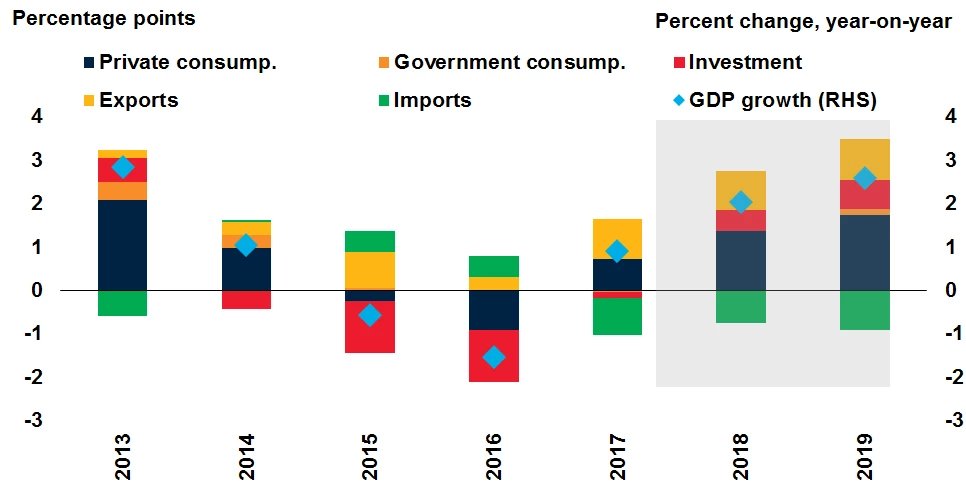
Sources: Haver Analytics, World Bank.
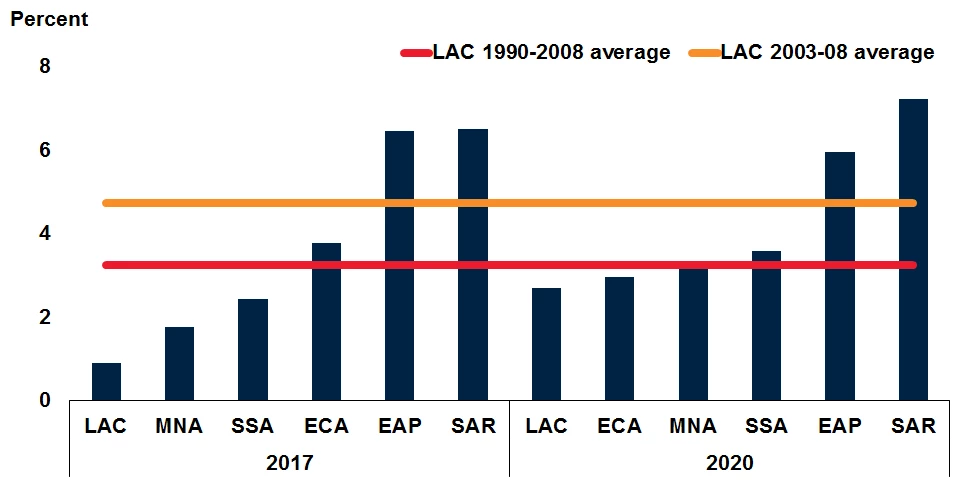
Yet growth in Latin America and the Caribbean will continue to underperform
Despite the projected acceleration in activity, growth in the region is expected to remain below its long-term average—and below that of all other emerging and developing economy regions—as external drivers of growth are only moderately supportive. The large gains in some commodity prices (energy and metals) in 2017 are not expected to continue, while growth in the United States, to which the region is deeply tied through trade and financial flows, is forecast to decelerate in 2019 and 2020.
Regional Growth Compared to Other Regions and Historical Levels
Sources: Haver Analytics, World Bank.
Potential growth will remain weak
Moreover, Latin America and the Caribbean appears set to experience a modest deceleration in already weak potential growth, the level of output that would be sustained at full capacity utilization and full employment, in part due to decreasingly favorable demographic trends. Investment growth is anticipated to recover, but not to the stimulus-fueled rates of the early 2010s, thus limiting gains in the contribution of capital to potential growth. Potential growth in the region is also held back by longstanding weak total factor productivity.
Contributions to Regional Potential Growth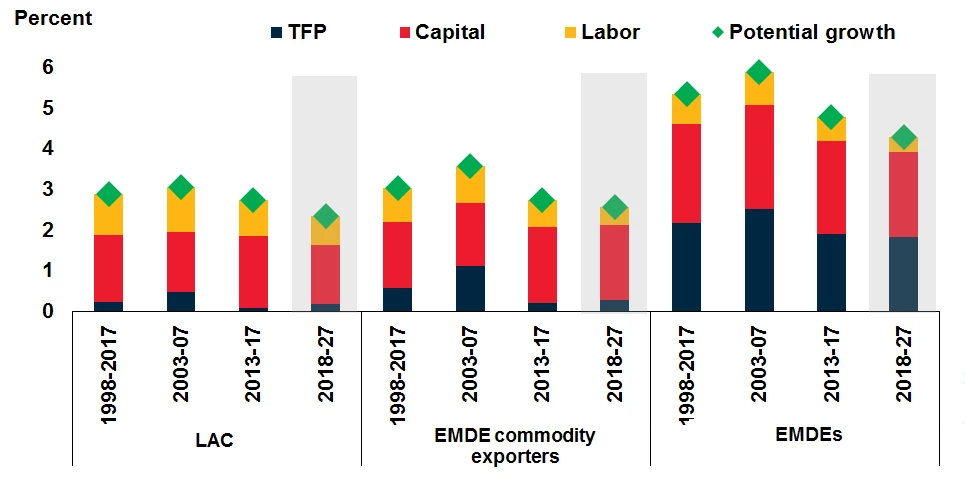
Source: World Bank.
Real activity indicators in Brazil improved markedly in 2017
Brazil’s recovery is expected to solidify in 2018. The economy is anticipated to grow 2 percent as improving labor conditions and low inflation support private consumption, and as policy conditions become more supportive of investment.
Industrial Production and Retail Trade, Brazil
Sources: Haver Analytics, World Bank.
Notes: Lines show 3-month moving averages using non-seasonally-adjusted data. Last observation is October 2017.
Investment is recovering
Although the contraction in fixed investment in the region continued for a fourth consecutive year in 2017, in part due to policy uncertainty, it is easing. Investment growth has been positive in recent quarters in some large economies, including Argentina and Peru.
Regional Investment Growth
Sources: Haver Analytics, World Bank.
Note: Line shows GDP-weighted average of gross fixed capital formation growth in Argentina, Brazil,
Chile, Colombia, Mexico, and Peru using non-seasonally-adjusted data. Bars show contribution of each of
the six economies to regional investment growth. The six economies shown in the figure represent 85
percent of regional GDP.
Accelerating private consumption and investment will lift regional growth in 2018 and 2019
Regional growth is projected to gain momentum in the next two years, rising to 2 percent in 2018 and 2.6 percent in 2019. The growth acceleration is anticipated to be supported predominantly by strengthening private consumption and, to a lesser degree, by investment.
Components of Regional Growth
Sources: Haver Analytics, World Bank.
Note: GDP-weighted averages. Bars show contribution of each of the components of GDP to regional growth.
Yet growth in Latin America and the Caribbean will continue to underperform
Despite the projected acceleration in activity, growth in the region is expected to remain below its long-term average—and below that of all other emerging and developing economy regions—as external drivers of growth are only moderately supportive. The large gains in some commodity prices (energy and metals) in 2017 are not expected to continue, while growth in the United States, to which the region is deeply tied through trade and financial flows, is forecast to decelerate in 2019 and 2020.
Regional Growth Compared to Other Regions and Historical Levels
Sources: Haver Analytics, World Bank.
Note: GDP-weighted averages. EAP = East Asia and Pacific, ECA = Europe and Central Asia, MNA = Middle East and North Africa, SAR = South Asia, and SSA = Sub-Saharan Africa.
Potential growth will remain weak
Moreover, Latin America and the Caribbean appears set to experience a modest deceleration in already weak potential growth, the level of output that would be sustained at full capacity utilization and full employment, in part due to decreasingly favorable demographic trends. Investment growth is anticipated to recover, but not to the stimulus-fueled rates of the early 2010s, thus limiting gains in the contribution of capital to potential growth. Potential growth in the region is also held back by longstanding weak total factor productivity.
Contributions to Regional Potential Growth

Join the Conversation