 Shutterstock
Russia’s invasion of Ukraine has not only caused an enormous humanitarian catastrophe, but an economic shock as well—markedly hastening the deceleration in global economic activity . The war in Ukraine is leading to high commodity prices, adding to supply disruptions, increasing food insecurity and poverty, exacerbating inflation, contributing to tighter financial conditions, magnifying financial vulnerability, and heightening policy uncertainty. Against this backdrop, the Global Economic Prospects projects that global growth will slow down sharply, to 2.9 percent in 2022. Various downside risks cloud the outlook, including intensifying geopolitical tensions, growing stagflationary headwinds, rising financial instability, continuing supply strains, and worsening food insecurity. The global community needs to prioritize efforts to mitigate humanitarian and food crises. Policy makers in emerging markets and developing economies (EMDEs) are facing rising inflation, soaring borrowing costs, and elevated debt levels. Rather than implementing export restrictions or price controls, policy makers can instead opt to reprioritize spending toward targeted relief for vulnerable households. Over the long run, policies that reverse the damage inflicted by the dual shocks of the pandemic and the war on growth prospects, including those that improve education and raise labor force participation will be required .
Russia’s invasion of Ukraine is hastening an already pronounced global slowdown.
The effects of the invasion—including more acute inflationary pressures and a faster pace of monetary tightening than previously expected—account for most of the 1.2 percentage point downward revision to this year’s global growth forecast . Headwinds from the war in Ukraine are adding to large cumulative losses in output since the onset of the pandemic, particularly for commodity-importing EMDEs.
Chart 1. Cumulative output losses, 2020-24
Percentage of 2019 GDP
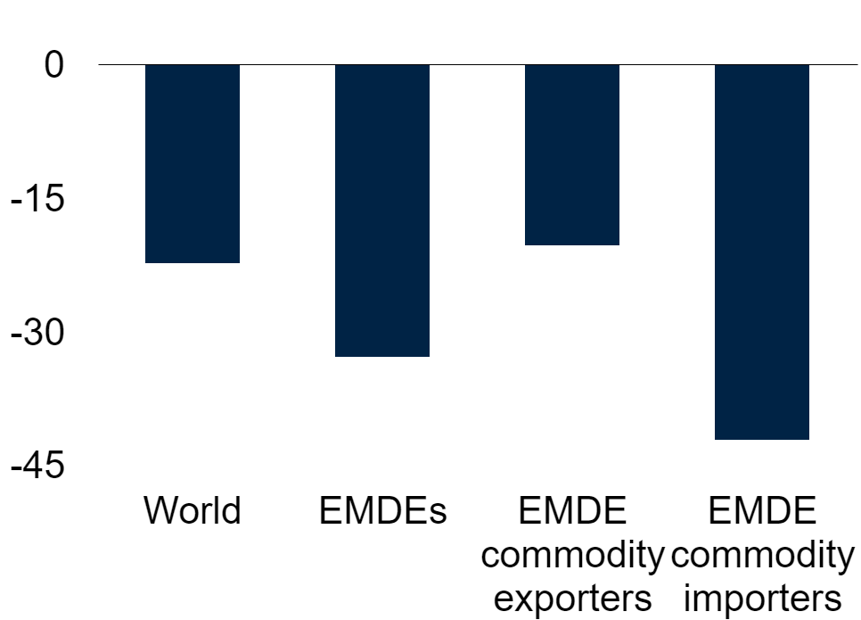
Sources: Consensus Economics; World Bank.
Note: EMDEs = emerging market and developing economies. Bars show cumulative output losses over 2020-24, which are computed as deviations from trend, expressed as a share of GDP in 2019. Output is measured in U.S. dollars at 2010-19 prices and market exchange rates. Trend is assumed to grow at the regression-estimated trend growth rate of 2010-19. EMDE commodity exporters exclude the Russian Federation and Ukraine.
With the exception of some energy-exporting EMDEs, this year’s growth outlook has been downgraded in the vast majority of countries.
EMDE output is expected to slow from 6.6 percent in 2021 to 3.4 percent in 2022 due to negative spillovers from the war in Ukraine and a deteriorating global environment—including commodity price volatility, global trade disruptions, tighter financing conditions and softening external demand. Other than the pandemic-induced recession in 2020, this is the weakest year of EMDE growth since 2009. Growth forecasts for 2022 have been downgraded in nearly 70 percent of EMDEs, including the vast majority of commodity-importing countries. With the exception of some energy-exporting EMDEs, the majority of countries have suffered downgrades across all country groups.
Chart 2. Forecast revisions to 2022 growth
Percent of countries
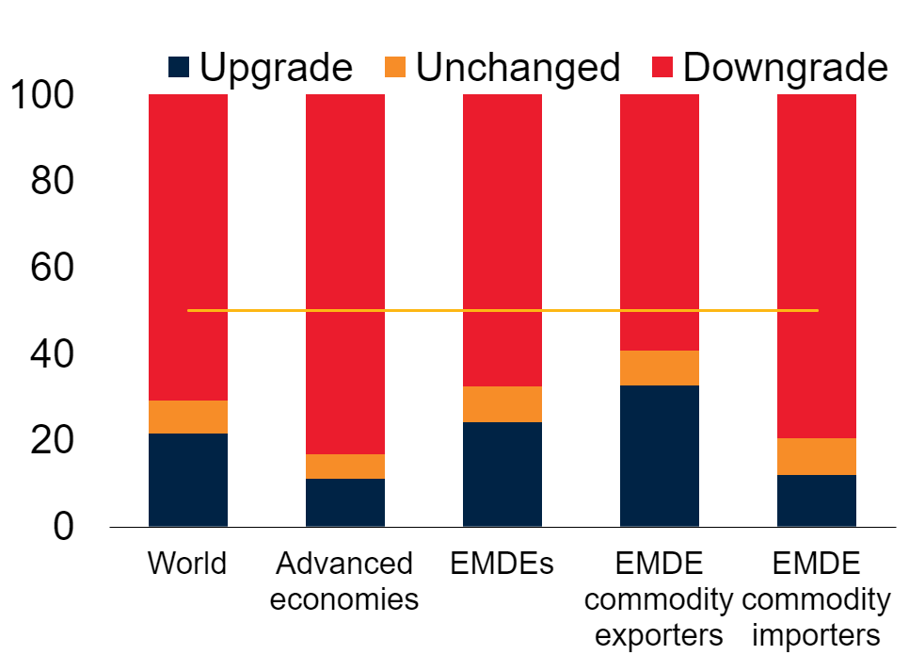
Source: World Bank.
Note: EMDEs = emerging market and developing economies. Forecast revisions are the change in 2022 growth forecasts between January 2022 and June 2022 editions of Global Economic Prospects. Data for 2022 are forecasts.
Exacerbated by the war in Ukraine, inflationary pressures have continued to build and broaden across the world, raising the risk of stagflation.
Global consumer price inflation has risen substantially around the world and is above central bank targets in almost all countries which have targets. Inflation is envisioned to remain elevated for longer and at higher levels than previously assumed. It is expected to peak around mid-2022 and then decline gradually as global growth moderates, demand shifts further from goods toward services, supply chain bottlenecks abate, and commodity prices edge down (albeit at high levels), including for energy. However, additional adverse shocks could increase the possibility that the global economy will experience a period of stagflation reminiscent of the 1970s, with tepid growth and high inflation [Global Stagflation].
Chart 3. Countries with inflation above target
Percent of countries

Sources: International Monetary Fund; World Bank.
Note: EMDEs = emerging market and developing economies. Bars show the share of inflation-targeting economies with average inflation during the course of the year (or month) above the target range. Sample includes 12 advanced economies and 31 EMDEs.
Several downside risks could materialize at once, leading to an even sharper slowdown in global growth.
This Global Economic Prospects report features simulations from a global macroeconomic projection model to assess key downside scenarios for the global economy. In the first scenario, U.S. monetary policy tightening would be substantially accelerated to rein in inflation. In the second scenario, renewed disruptions to energy markets related to the war in Ukraine would deliver a large spike in global energy prices, particularly those of oil and natural gas. In the third scenario, a large-scale COVID-19 resurgence in China would prompt authorities to reimpose strict lockdowns. The simultaneous materialization of all three scenarios would reduce global growth to only 2.1 percent in 2022 and 1.5 percent in 2023—0.8 and 1.5 percentage points slower than in the baseline forecast. This would bring the global economy to the brink of recession—and when combined with heightened risks of persistently high inflation—raise the probability of stagflation.
Chart 4. Global growth scenarios
Percent

Sources: Oxford Economics; World Bank.
Note: Scenario outcomes produced using the Oxford Economics Global Economic Model. Scenarios are linearly additive. Aggregate growth rates are calculated using real U.S. dollar GDP weights at average 2010-19 prices and market exchange rates.
Global cooperation and judicious national policies will be needed to tackle mounting food insecurity, without resorting to distortive policies.
In 2021, more than 190 million people had already experienced acute food insecurity. Russia’s invasion of Ukraine has further contributed to this, pushing up global food prices and heightening the risk of severe food shortages . Improving access to safe and nutritious food, and maintaining food security in times of crisis, are critical for health and human development. To the extent possible, policy makers in EMDEs need to refrain from responding to rising prices of food and fertilizers by adding to the already-high number of price controls, which are often paired with subsidies. Trade restrictions should also be avoided and, where possible, pared back.
Chart 5. People in acute food insecurity
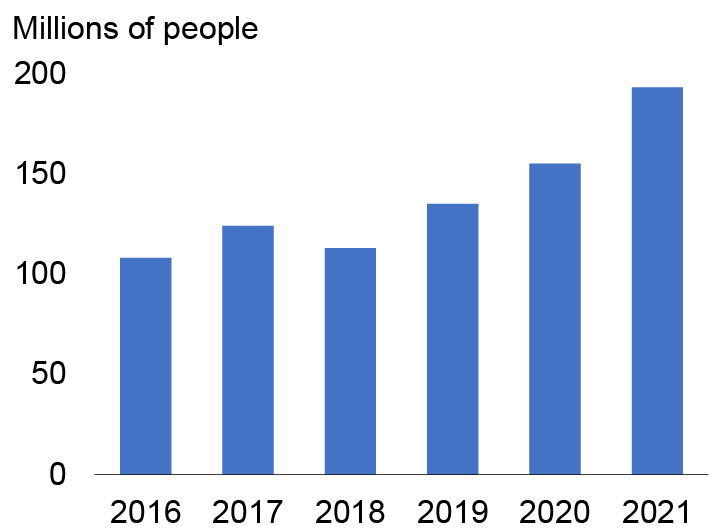
Sources: FSIN and GNAFC (2022); World Bank.
Note: Data from the Food Security Information Network’s Global Report on Food Crises 2022.


Join the Conversation