Over the last twenty years, impact evaluations have dramatically expanded the body of evidence about which types of development programs work, when, and why, but their application has been heavily concentrated in a few sectors. 83% of the trials in 3ie’s worldwide repository are focused on health, nutrition, and population programs.
By comparison, evaluations of infrastructure programs have notably lagged (with some estimates indicating that less than 1% of all evaluations focused on projects in the transport sector, for example). This shortage stands in stark contrast to new findings from developed countries or historical contexts showing major gains from transport and related investments (see, for example, papers [1] [2] by Donaldson and coauthors). One natural reason for this shortage is that randomized assignment of infrastructure upgrades is often infeasible, politically challenging, or otherwise problematic. To compensate, we naturally turn to quasi-experimental methods, but these often hinge on sufficiently frequent panel data or identifying (rare) natural experiments (see examples here, here, and here). Recent efforts by the DIME team at the Bank have led to 10 new evaluations in the transport sector.
However, even these efforts leave a glaring blind spot: in contexts plagued by violence and political instability, survey data collection is often dangerous, difficult and/or prohibitively expensive. As a result, there are very few examples of reliable evaluation findings from infrastructure investments in conflict-affected zones, even while large-scale projects in these contexts continue to be funded. For example, 3ie has funded six ongoing impact evaluations in infrastructure; none of these covers a conflict-prone site.
Remote sensing technologies have the potential to dramatically expand opportunities for impact evaluation in general; they offer particular advantages in fragile and conflict-affected contexts. Satellite imagery capturing nighttime lights, vegetative greenness, and other outcomes of interest provides evaluators with more frequent and often more spatially precise observations. The frequency of the data lets us better trace out differences across the sharp timing of project interventions while accounting for fixed effects at very granular levels. While still subject to the usual need for validation, these large N, frequent t panels give us substantially more confidence in the causal identification of treatment effects. Moreover, the wide coverage of this data lets us ask what happens to impacts along complex networks and at varying distances from these investments.
Of course, with no free lunch, these data come with some serious constraints as well. I have used the nighttime lights and daytime greenness indices in two recent studies of infrastructure investments in conflict-affected areas, and learned some key lessons along the way.
In the first evaluation, my colleagues at AidData and I used the newer nighttime lights series provided through NOAA’s VIIRS project to estimate the local economic impacts of a rural roads program in the West Bank. The lights data are increasingly validated as a proxy for local economic development that is particularly useful in countries where GDP and other outcomes cannot be consistently measured over time and geographic space. The VIIRS data have some differences from the earlier DMSP series: they are available at monthly (rather than annual) time steps and at slightly finer spatial scales (750m vs. 1km grid cells). They are also collected later at night (typically ~1am rather than 8pm), so reflect somewhat different aspects of economic activity. 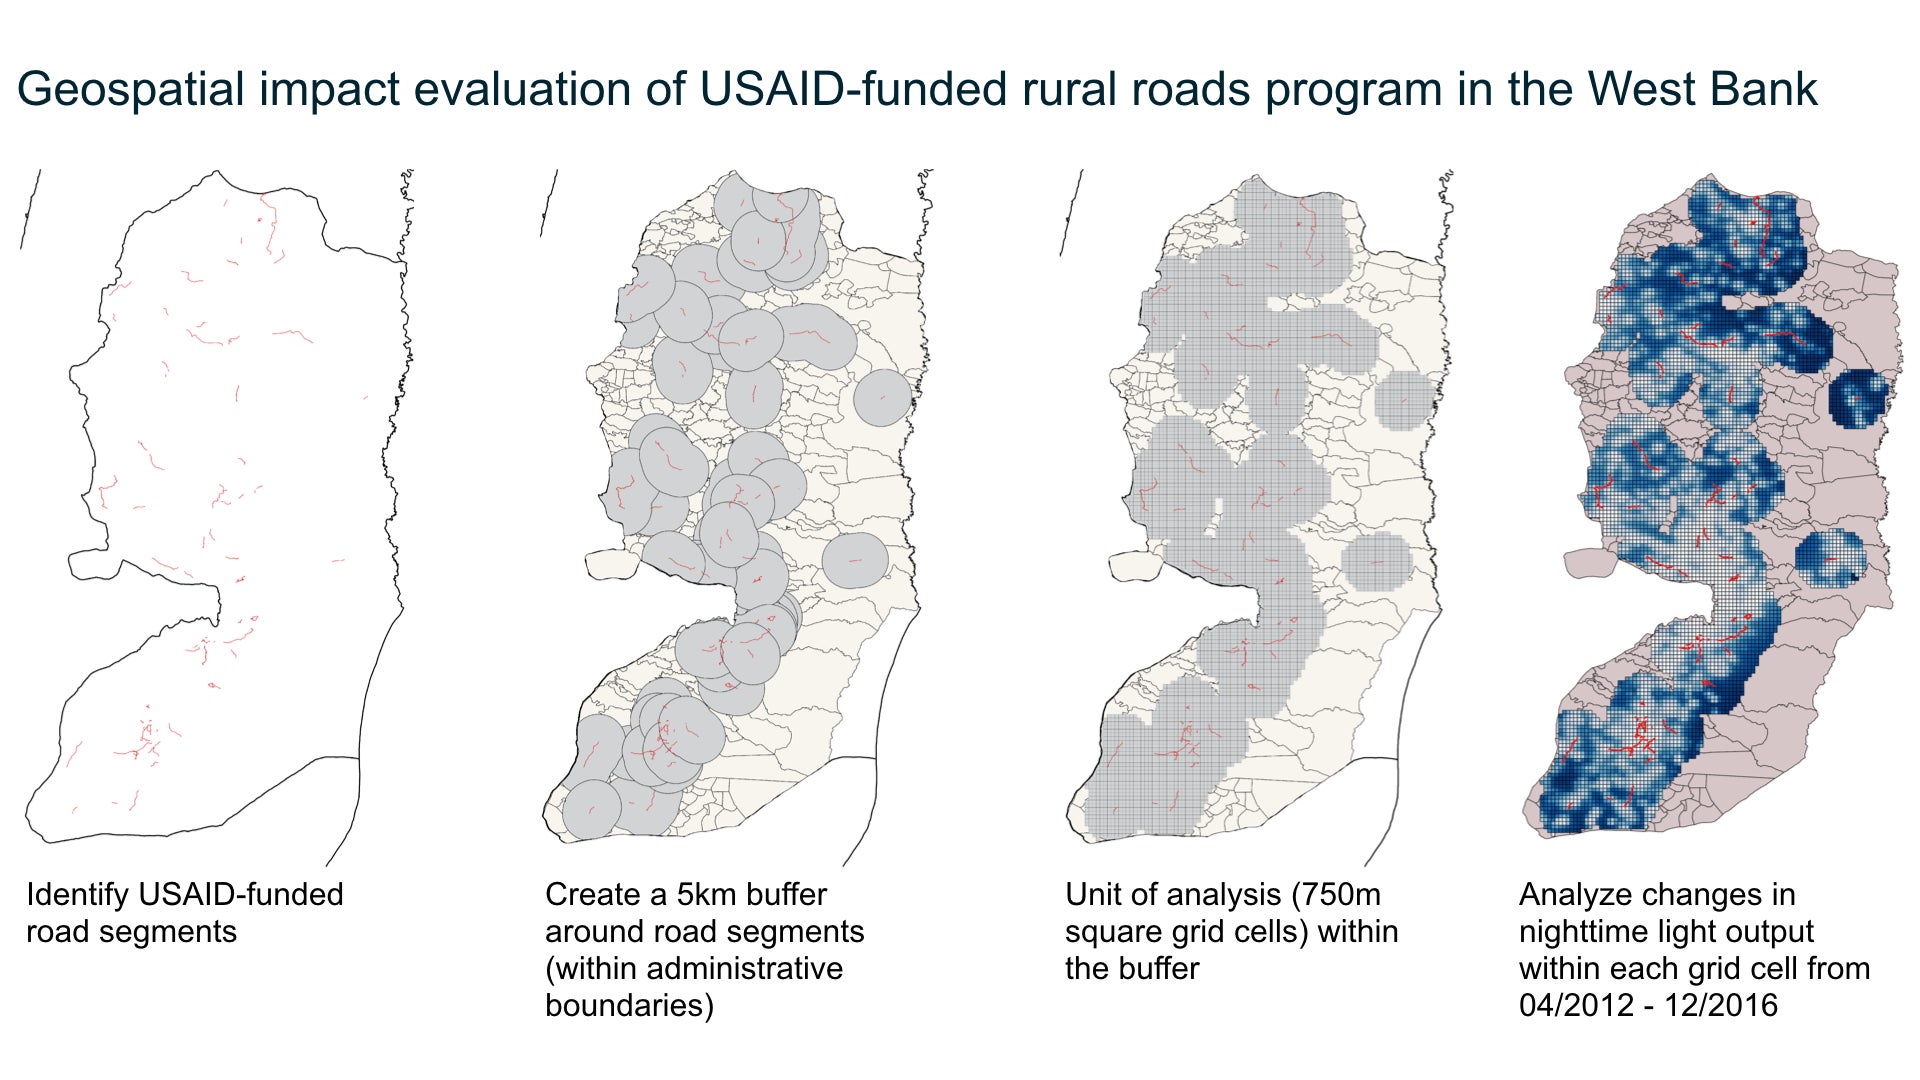
For purposes of evaluations in conflict-affected areas, the monthly time scales can prove quite important. The USAID project in West Bank improved road segments over a fairly short window of three years (March 2013 – July 2016), and the annual DMSP series would likely not have sufficient variation to identify the treatment effects. In fact, we find large treatment effects of approximately 10% of baseline lights that occur fairly shortly (i.e. within a year) after the upgrades are completed. Since dynamics in conflict-affected areas are often rapidly changing, the ability to detect treatment effects more quickly (as well as to adjust for any within-year seasonality or dynamics using month fixed effects, etc.) can be particularly valuable.
One challenge in linking lights and linear infrastructure data is understanding not only the extensive margin but also what happens when areas benefit from multiple improvements. In our context, we find non-linear benefits that accrue as each grid cell is treated by additional nearby road improvements. To date, there is not yet sufficient evidence on the linearity of the relationship between the lights data and economic activity to know whether these non-linearities are a measurement feature or actual features of the economic impact distribution.
A good complementary study by Roy van der Weide and colleagues at the WB finds that when roads in the West Bank become impassable due to (plausibly exogenous) Israeli roadblocks, nighttime lights in affected areas diminish. This paper finds changes taking place exactly at the same time that many violent flare-ups occurred, making frequent and reliable surveys challenging.
The glaring gap in evaluations in these conflict-affected zones need not be something we only tackle prospectively. In settings like Afghanistan, collecting detailed household data in rural areas can certainly be done, but requires tremendous effort and cost. Whether a project is evaluable using existing sample survey data thus often hinges on the overlap between these samples and interventions. Satellite imagery that is available over much broader scales allows us to retrospectively revisit completed projects in more cases and with greater reliability.
In a recent effort, colleagues at AidData and I evaluated another large-scale USAID infrastructure project in Afghanistan, this one making investments in 80 irrigation canals in a third of the country’s provinces between 2013 and 2016.
One optimistic lesson we learned: sometimes, the much larger samples available from satellite imagery can compensate for noise in proxy measures for specific outcomes. In this particular case, we examined wheat productivity using vegetative greenness measures (the Normalized Difference Vegetative Index) using the Landsat series, available at 30m every few weeks. There are few existing studies documenting the relationship between on-the-ground measurement of wheat in this region and satellite measures at the 30m scale. Nonetheless, with data from Afghanistan on over 200,000 grid cells at seasonal (quarterly) scales over a decade, and sufficient variation to allow for plausibly exogenous variation in the timing of canal improvements, we identify increases in greenness of 15% (and lots of important heterogeneity in those effects). Again, the sharp timing variation and intra-annual outcome measures let us detect impacts within two years of the completion of the median canal.
I am now more optimistic that we can assess what role donors are playing in conflict-affected areas, even absent the ability to send large teams of enumerators into the field on a regular basis.

Join the Conversation