The growing availability of satellite imagery and analysis means that all kinds of things we used to think were hard to quantify, especially in conflict zones, can now be measured systematically.
For example, estimating ISIS oil production. Soon after it proclaimed itself the Islamic State in Iraq and the Levant (a.k.a. ISIL/ISIS, the Islamic State, or Daesh, its Arabic acronym), the group was quickly branded the richest terrorist organization in history and oil was believed to be its major revenue source. A typical headline in Foreign Policy proclaimed “The Islamic State is the Newest Petrostate.”
These early estimates were constructed from a careful investigation of production at a few selected sites –often places where journalists could develop a source— and then extrapolated. The revenue estimates varied from as low as US$300,000 to up to US$3,000,000 daily, which makes sense given the few data points and one or two outliers that can drive the estimates.
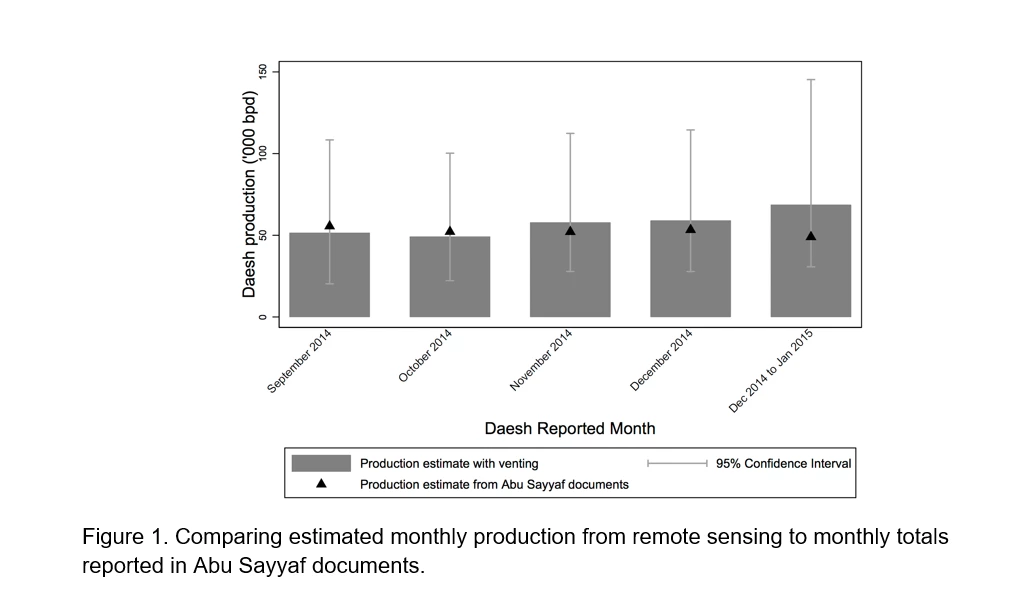
The first actual “census” of Daesh’s oil production was obtained from seized documents during a raid on the group’s senior financial official, Abu Sayyaf. These documents included internal reporting on production for various months, presumably calculated by aggregating production figures for each field.
In a newly released paper, we created an alternative estimate of ISIS oil production by assessing daily production and for every single oil well under control of the terrorist group, using remote sensing data.
Our quantitative approach is based on oil extraction in the region typically associated with gas flaring. Since remote sensing can measure each intense heat source, ISIL’s production can be assessed by looking at the intensity of the flares. Could the terrorist group produce oil without gas flaring? Evidence from night-time imagery suggests that they did not to a large extent, allowing us to follow production on a day-to-day basis and for all wells in controlled areas.
The estimates are quite close to the ones computed from administrative records from Abu Sayyaf, as shown in Figure 1.
The ability to assess field-level trends over time without physical access provides insight into the group’s level of control and likely future revenues. Moreover, after the demise of the Islamic State group, knowing how much oil is immediately available and which fields suffered the worst damage is important information for financing and planning reconstruction.
Our work is but one example of a broader principle. Essentially, any feature that a human can reliably pick out in an image can now be quickly measured across a large area using machine learning tools. This work is but one example of quantitative evidence being increasingly used to inform decision-making on a variety of development-related activities including:
- Legal and illegal logging across the globe;
- Mining in poorly governed spaces and its links to conflict;
- Conflict events, including in areas with no press coverage;
- Market activity, particularly in regions inaccessible to outsiders; and
- Household income and poverty with much greater geographic precision than is possible using traditional survey methods.
Of course, remote sensing data cannot substitute for deep local knowledge and expertise
The most effective policy evaluations, and most promising research, often rely on deep local knowledge to formulate how to leverage data to reveal hidden patterns and learn which policies worked, and which did not. But this new era of remote sensing for development can provide precise, replicable measurements of many outcomes and thereby open up promising opportunities for policy and research.


Join the Conversation