
(Note: China and India were broken out in this graph due to the distorting effect of their populations on the estimations per region.)
According to the International Telecommunications Union (ITU), broadband can be considered affordable when it is at or below five percent of the average monthly income [1]. Statistics are usually reported on country averages; under a “Broadband for All” objective, it might be useful to realize that behind averages income is distributed unevenly among the population of a country. That is, even if broadband prices are effectively under five percent of the average monthly income of a country, that same price indeed represents a higher share of the income of the poorest segments of the population.
In this blog post, I will try to show the differences that averages hide, as well as highlight the importance of addressing specific segments of the population, especially when dealing with the bottom 40 percent of the population, which are – almost by definition – usually underestimated on average.
Using statistics from ITU and World Development Indicators (WDI), I have tried to calculate (grossly and certainly with lots of room for improvement) a tool to measure this “affordability gap” between countries and – more importantly – within countries.
WDI statistics include income distribution statistics, namely the income for the top and bottom deciles of the population, plus income per quintile. So, taking the latest information on income distribution and applying it to the latest reported gross national income (GNI) per capita, I have tried to extrapolate a distribution for income for countries. The result is a proxy of the income distribution of the per capita income per decile:
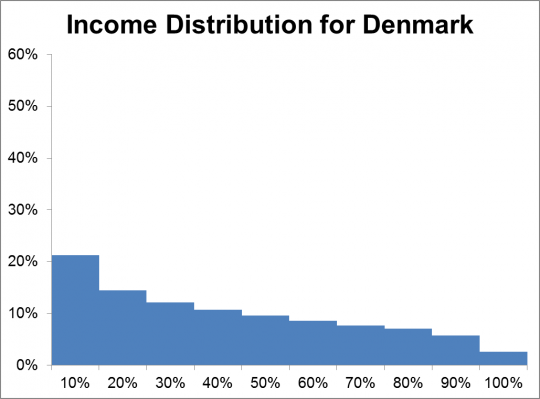
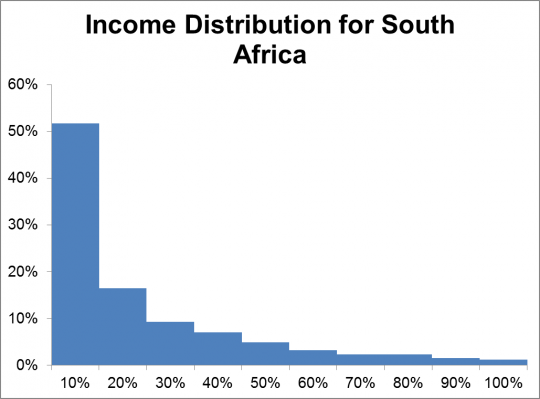
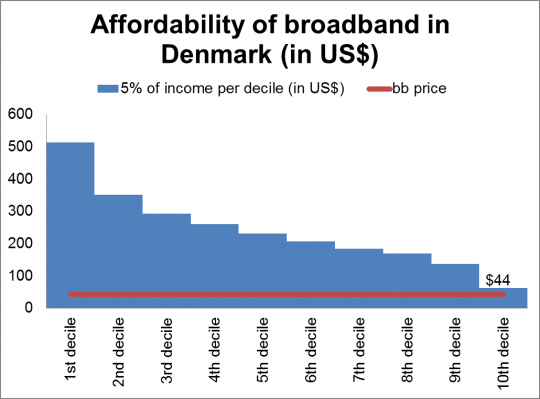
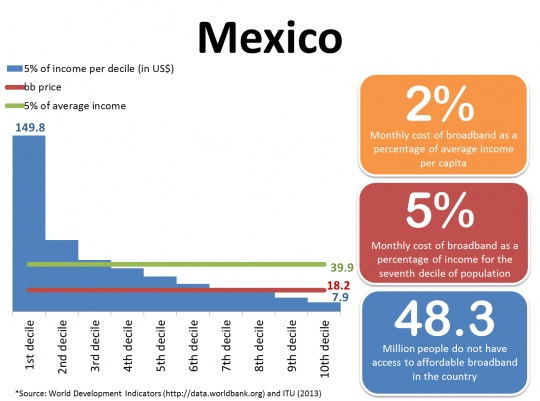
With the distribution, we can also arrive at an estimation of the distribution of income for each country. Additionally, information provided by ITU includes the monthly price for fixed broadband access. From this, we can estimate for which portion of the population broadband can cost more than five percent of their monthly income [2]. For example, at $44, all of Denmark's population can afford fixed broadband (five percent of monthly income is higher than $44 for all deciles of the population). On the other hand, only 30 percent of the population of South Africa can afford fixed broadband at $27 per month (that is, $27 is higher than five percent of monthly income for the first three deciles of the population). The graph below shows this comparison (the blue area represents five percent of monthly income and the red line is the monthly price of fixed broadband).

Data was available for 143 countries, covering approximately 6.7 billion people. Income distribution data is very outdated for some countries, going back to early 1990s in some cases.
Results
The following table summarizes the overall findings from this relatively simple exercise:
Table 1. Broadband Affordability(Number of countries)
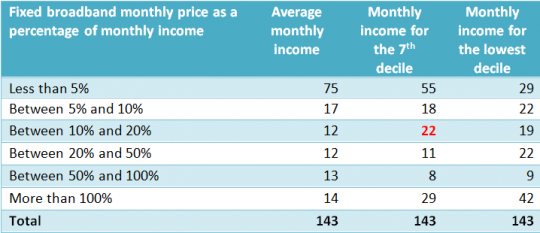
The columns on the table are determined by different “monthly income” estimations, and the numbers shown are the count of countries that meet the criteria shown on the left. For example, the number 22 shown in bold means that 22 countries have a broadband price that is between 10 percent and 20 percent of the monthly income of the 7 th decile of their population.
If we just look at the national average income level (the first column), 75 out of the 143 (52 percent) countries analyzed have broadband prices that are five percent or less of their monthly income, which supports the claims made by some analysts that many countries already have affordable broadband service. Moreover, these 75 countries account for almost five billion people, suggesting that most people in the world have access to affordable fixed broadband service.


However, a closer look at the distribution of income shows a different picture. For example, there are approximately 20 countries where, despite having broadband prices below five percent of their average income, broadband is still unaffordable for the bottom 40 percent (see, for example, China above). In fact, only 29 countries out of the 75 mentioned before can claim under this analysis that broadband is affordable for the 100 percent of their population.
It is also interesting to note that there are 14 countries where the monthly price of broadband is more than 100 percent of the average monthly income. Moreover, there are 39 countries with an estimated aggregated population of more than 840 million people that have broadband prices higher than five percent of monthly income for all deciles – that is, unaffordable for close to 100 percent of the population (see, for example, Iraq above).
Taking into account this analysis by deciles and applying it to all the countries, an estimated 3.5 billion people do not have access to affordable fixed broadband, as shown in the figure on the top of this post.
This post only intends to highlight the need for a more detailed analysis of affordability within countries. Whereas an "average" analysis of affordability could suggest that most people have access to affordable broadband around the world, in reality many segments of the population are not able to afford broadband service. This oversight may end up exacerbating differences within countries that may end up increasing the digital divide, with negative effects on the extreme poor and on any attempt to increase the income of the bottom 40 percent.
The analysis shows that almost 3.5 billion people are being left without affordable broadband, spread all over the world. Further analysis at the country level should be carried out to determine the different options to make broadband more affordable.
Other considerations
The analysis carried out in this note examines aggregated prices and income statistics. Additional research should be carried out at a regional or preferably country level. For example, the "Broadband Networks in MENA: Accelerating High-Speed Internet Access" report includes a more in-depth analysis of affordability for several countries in the region.
It is important to mention that the definition of broadband is that of ITU: 256kbps or higher. The trend, however, is to move towards faster connection speeds (5Mbps and up, also called Ultra-Fast Broadband or UFB). To measure a “Broadband for All” initiative, we need to define the service and what constitutes an affordable access to the service. Higher minimum speeds would imply higher prices to be considered, and all estimations done in this analysis would be affected negatively.Related to the above, the five percent benchmark may need to be revisited. On one hand, broadband is usually seen as a household service and some countries are starting to measure its penetration in terms of households. On the other hand, mobile broadband is a personal service that is seldom shared within a household. Lastly, it is important to highlight the fact that broadband costs do not include other telecommunications services (namely, mobile and fixed line).
It is also important to note that the analysis does not include coverage or quality of service. In many countries, access to broadband is limited only to some urban areas, and extending access to the rest of the country (especially rural and low income areas) would imply high investments that companies are rarely willing to make. Similarly, a low quality of service might be making up for lower prices in some environments with weak legal and regulatory environments. In any case, these considerations would indicate and underestimation of the affordability gap found in this note
Information for selected countries


[1] A similar exercise could be done on mobile broadband, although speed and pricing options may complicate the analysis.
[2] “The State of Broadband 2013: Universalizing Broadband”, Broadband Commission (2013), available at:
http://broadbandcommission.org/Documents/publications/bb-annualreport2013.pdf

Join the Conversation