The headlines started to stream as soon as the PISA results were in: “Asian countries top OECD's latest PISA survey.” “Poor academic standards.” “Students score below international averages.” It depends on the country, of course. A time to celebrate for some, a time to lament for others.

Today, the Organisation for Economic Co-operation and Development (OECD) released results from the Programme for International Student Assessment (PISA) 2012 / Fifth Survey. PISA tests 15-year-olds in reading, math and science. This year, 65 countries and economies took part; in total, more than 70 countries have taken part since 2000, when PISA began.
As in 2009, Shanghai-China again outperforms other economies and countries, by a significant margin, with a mean scores of 613, 570 and 580 in math, reading and science. Top-performing economies in math include Singapore (573), Hong Kong SAR, China (561), Chinese Taipei (560), Korea (554), Macao SAR, China (538), Japan (536), Liechtenstein (535), Switzerland (531) and the Netherlands (523).
Top-performers in reading include Hong Kong SAR, China (545), Singapore (542), Japan (538), Korea (536), Finland (524), Ireland (523), Canada (523), Chinese Taipei (523) and Poland (518). Top-performers in science include Hong Kong SAR, China (555), Singapore (551), Japan (547), Finland (545), Estonia (541), Korea (538), Poland (526), Canada (525) and Liechtenstein (525).
Newcomer Vietnam performed very well, with scores of 511 in math, 508 in reading and 528 in science, all significantly above the OECD average.
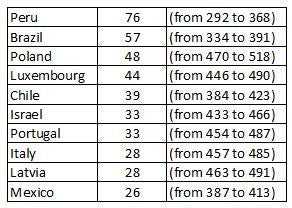
Since the first round in 2000, no country has improved more than Peru: 76 points in math, 57 in reading and 40 in science; albeit from a relatively low base (from 292 to 368 in math between 2000 and 2012).
Between 2000 and 2012, the following countries have recorded the highest increase in math scores:
In reading: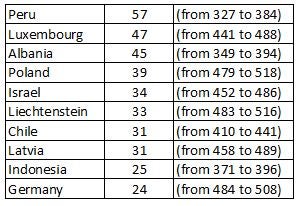
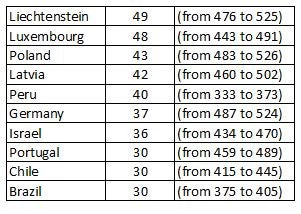
In science:
These impressive gains are inspiring, but there is still a long road from this level to the level of high performers. Few countries have gone from below to above OECD average (exceptions include Poland, Germany, Latvia, Luxembourg and Lichtenstein). No doubt, these achievement trends and the wealth of information provided by OECD’s PISA tests will help researchers and policymakers lead a fruitful exercise to glean lessons for academic performance.
Follow the Bank’s education team on Twitter: @WBG_Education
Related
PISA 2012 Results (OECD)

Join the Conversation