In June, a joint team from Operations Risk, Public Sector Governance and Integrity and Controllers invited researchers from the Corruption Research Center Budapest (CRCB) – Mihály Fazekas and István János Tóth – for a week of discussions with Bank staff on the measurement of corruption risk in public procurement, utilizing big data.
CRCB is an NGO made up of an interdisciplinary team of political scientists, economists, computer scientists and lawyers. Their goal is to help citizens understand corruption in public spending and quality of government, focusing on the public procurement process. Over the past few years, CRCB have been collecting vast quantities of previously unexploited data on public procurement for some countries in Europe, sifting through these datasets to analyze risk of corruption and evidence of cartels, using a combination of quantitative and qualitative methods.
What’s noteworthy about CRCB’s indirect measurement approach is that indicators are based on administrative data (this data is typically generated at the transactional level, resides in silos across a host of public agencies and functional departments, is sometimes open and is sometimes privately held by public, private and international organizations). The indicators are not based on perceptions of individuals who might provide an opinion about control of corruption in the country. In view of corruption being clandestine, CRCB’s approach lays emphasis on bringing to light seemingly innocuous traces of corruption in official records of public procurement, firm financial information, ownership of companies, and various records of public officials based on an understanding of the country context. They are based on the assumption that corrupt agencies are adept at “covering their tracks” with regard to the formal legal framework for public procurement. On the surface, the process looked impartial, transparent, fair, open, provided equal access to bidders and promoted competition. The process nevertheless may have left some clues that hinted at manifestations of corruption, such as: single bidder submitted or was considered for the bid, the call for tender was not advertised in an official journal, emergency procedure was used to speed up the process, there was an unusually short length of time for advertising the bid, the procurement process was annulled and re-launched subsequently, non-price evaluation criteria were given more weight, contracts were modified during the implementation, contract values or duration increased.
Visibly, by utilizing this approach, the methodology veers from the commonly accepted definition of corruption -- the misuse of public office for private gain (Rose-Ackerman, 1978) – instead laying emphasis on impartiality in public spending, universalism and open access. (Alina Mungiu-Pippidi, 2006), and defining institutionalized grand corruption as systemic, recurrent and institutionalized. This is not too far from the Bank’s definition of corruption in public procurement (World Bank, 2009).
Some of the outputs from the CRCB’s analysis of Hungary, Czech Republic and Slovakia are appended below from Fazekas and Toth’s presentations:
General Findings:
1. Using CRCB’s Corruption Risk Index (CRI), which captures corruption risks inherent in the process of awarding and performing procurement contracts, it is possible to track changes in the potential risk of corruption over time and across countries, even on a monthly basis. (Fazekas et al, 2013). This data can also pick up qualitative shifts that may be affected by political transitions within individual countries.
Figure 1: Corruption Tracking Across Countries and Time
2. Drawing up the contractual network of high CRI procuring authorities and suppliers in Hungary in 2009-2010 reveals that there are distinct and highly interlinked clusters of organizations suggesting a partial capture of the state (Fazekas-Tóth, 2014).
Figure 2: State Capture - Some firms win repeatedly with the same agency
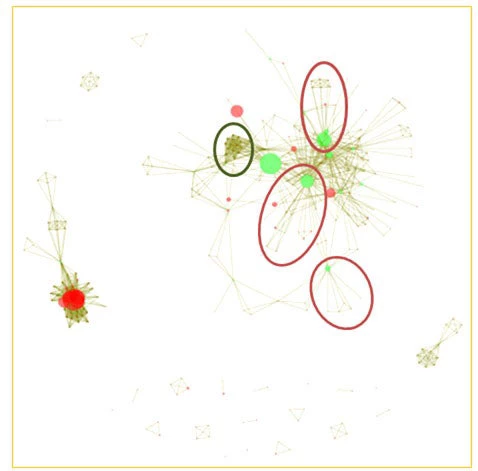
3. Constructing co-bidding networks of public procurement bidders allows for differentiating healthy competition from potentially collusive bidding (in a co-bidding network each vertex represents a bidding company and each tie is a tender where firms co-bid) (Czibik et al, 2014). Co-bidding clusters where most firms bid with all the others and many different firms win contracts suggests healthy competition on the face of it (see green elliptical circle highlighting one such dense cluster of bidders). Whereas a firm winning many contracts while it bids with companies which always lose and only bid with this firm suggests a cartel formation (see three red elliptical circles highlighting such network formations with large green large vertices representing companies winning multiple tenders).
Figure 3: Cartels - Some firms only bid together with a winner and lose recurrently
Findings from the IT Sector
1. Surprisingly, findings from Central and Eastern Europe reveal high corruption risks in IT services especially for large value and complex tenders. It is closely followed by other service sectors where performance assessment is complex and quality is intangible. On the other hand, sectors with standardized products, hence well comparable performance and prices, display considerably lower corruption risks.
Figure 4: Sectoral differences in average corruption risks (CRI) in Central and Eastern Europe
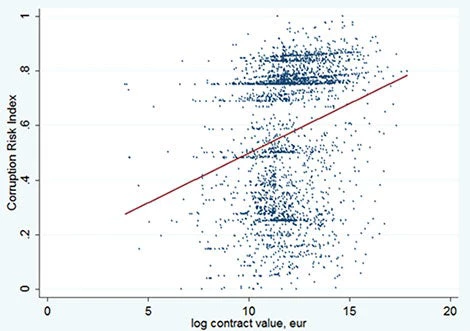
2. Drilling down further to contracts within IT services sector, the larger contracts tend to suggest higher corruption risks which could indicate that more complex and more difficult to manage projects are more prone to corruption.
Figure 5: Linear relationship between corruption risks (CRI) and contract value in the IT sector in Central and Eastern Europe
Lessons Learned:
Following a week of discussions, two major trends became clear with regard to the building of governance indicators based on public data and, regarding the importance of designing high quality public data:
1. Governance Indicators 2.0 – Moving from Perception-based to Administrative Indicators: Second-generation governance indicators point to a subtle shift from the use of perception based data to administrative data sources. However, building second generation governance indicators using ‘big data’ requires data availability on a real-time basis from electronic sources. These datasets are derived from transactional, micro-data level public administration systems describing the behavior of actors in the system. The data also needs to be linked to generate comparative findings across countries, organizations and time.
2. GIGO – Building High Quality Public Data: “Garbage in garbage out” was one of the aphorisms of the early computing era, which appear to continue to be an issue in the case of administrative data. High quality analysis needs high quality public data that can be linked across agencies. However, the approach to public administration and information technology projects in the past 20 years has seen the blooming of a thousand flowers and the dubious promise of expensive and arduous back-end data integration projects. Today, one of the toughest challenges in practice with measuring corruption risk is, that despite the hype and promise of “big data now!”, public administration datasets are scattered, must be hunted down, cajoled or begged for, painstakingly cleaned and then cross-referenced to put together pieces of a partially complete jigsaw puzzle, that can then lend itself to analysis. One can hope that the current big data and analytics age will provide a greater impetus for agreement at the international level for public administration data design, definitions and dictionaries, and on common standards for countries.
We would be interested to hear your views and perspectives. Tell us what you think.
** Source for all charts and research outputs referenced in this post: Mihály Fazekas and István János Tóth, CRCB.
Thanks go to Maria Vannari, Marcelo Donolo, Alexandra Habershon, Elizabeth Wiramidjaja, Martin Sterlicchi, Julia Bezgacheva and Amelia Yuson.
This post is part of a monthly series on Digital Gov. in developing countries. The series seeks fresh perspectives and insights into the policy, institutional and technical dimensions of technology and public management, in understanding how public services are modernized, organized and delivered to citizens and, in supporting openness and public accountability. The sixth post of the series reflects on the measurement of corruption risk in public procurement in the big data age.


Join the Conversation