- A new from evidence to policy note asks whether local communities can effectively run cash transfer programs – based on an impact evaluation by Dave Evans and others in Tanzania – communities selected the poorest households to participate – the program was randomly given to half the communities, and leads to improvements in the lives of the poor – the study does contrast having communities run CCTs with having a central government or other entity run them, but does show that such a program can be run by appropriately trained community groups.
- How to create animated graphics in Stata, from the Stata blog
- Acemoglu and Robinson on their new work claiming that democracy does have a robust effect on growth once you control for measurement error and for the fact that democratization often happens when countries are in the middle of an economic crisis (on the Why nations fail blog).
- Work for Berk in Liberia – he is looking for a project coordinator to oversee an impact evaluation of a program promoting girls empowerment.
- On the IDB blog – discussion of new work attempting to measure the spillovers from innovation policies in LAC. I think the selection into these programs can be severe at times, so am not sure how reliable matching + fixed effects results are, but given the lack of existing evidence, they are a step in the right direction.
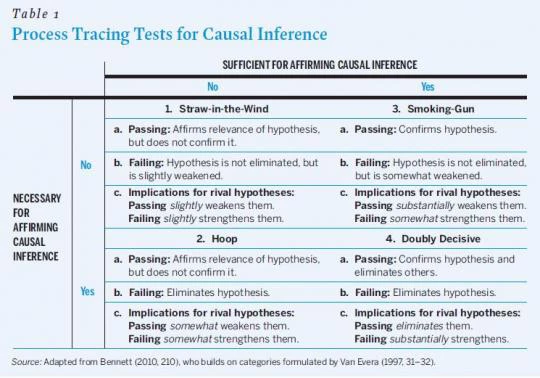
- Two new papers and one new book on process tracing methods, from Monitoring and Evaluation news – the first article he links to is interesting and designed as a teaching tool: “Process tracing is a fundamental tool of qualitative analysis. This method is often invoked by scholars who carry out within-case analysis based on qualitative data, yet frequently it is neither adequately understood nor rigorously applied….This article is accompanied by online teaching exercises, focused on four examples from American politics, two from comparative politics, three from international relations, and one from public health/epidemiology” It has this nice chart (and also uses a Sherlock Holmes case as an example to go through it!):

Join the Conversation