This is the seventh in our series of posts by PhD students on the job market this year
Governments in the world’s poorest countries face severe resource constraints. They collect only 10% of GDP in taxes compared to 40% in rich countries. In absolute terms, the gap is even more stark: the Democratic Republic of the Congo (DRC) raises US$63 in tax revenue per person, compared to US$17,100 per person in France (World Bank, 2020; ICTD, 2020). This lack of government revenue is associated with low-quality public services and infrastructure and may deter economic growth (Kaldor, 1965; Besley and Persson 2013).
My job-market paper studies how developing countries can increase the tax revenue they collect. My coauthors and I focus on the interaction between low enforcement capacity and the tax rate that would maximize revenues. In low capacity settings, increasing tax rates could fuel delinquency, which would offset the mechanical revenue gains from higher rates (Besley and Persson, 2009). However, investing in enforcement capacity could potentially attenuate the delinquency effects of raising rates (Keen and Slemrod, 2017). Investments in enforcement capacity may thus raise the revenue-maximizing tax rate.
Randomized Property Tax Rate Reductions in Kananga
To study the effects of tax rates on compliance and revenue, we partnered with the Provincial Government of Kasai-Central, DRC, which randomized property tax rate reductions at the property level in the context of its 2018 property tax campaign in the city of Kananga. The city’s 38,028 properties were randomly assigned to the status quo annual tax liability (control group) or to a reduction of 17%, 33%, or 50% (treatment groups). The tax liability was pre-populated on the tax letters received by property owners during property registration. To our knowledge, this is the first policy experiment to generate random variation in tax liabilities.
Reducing Tax Rates Increases Tax Revenues
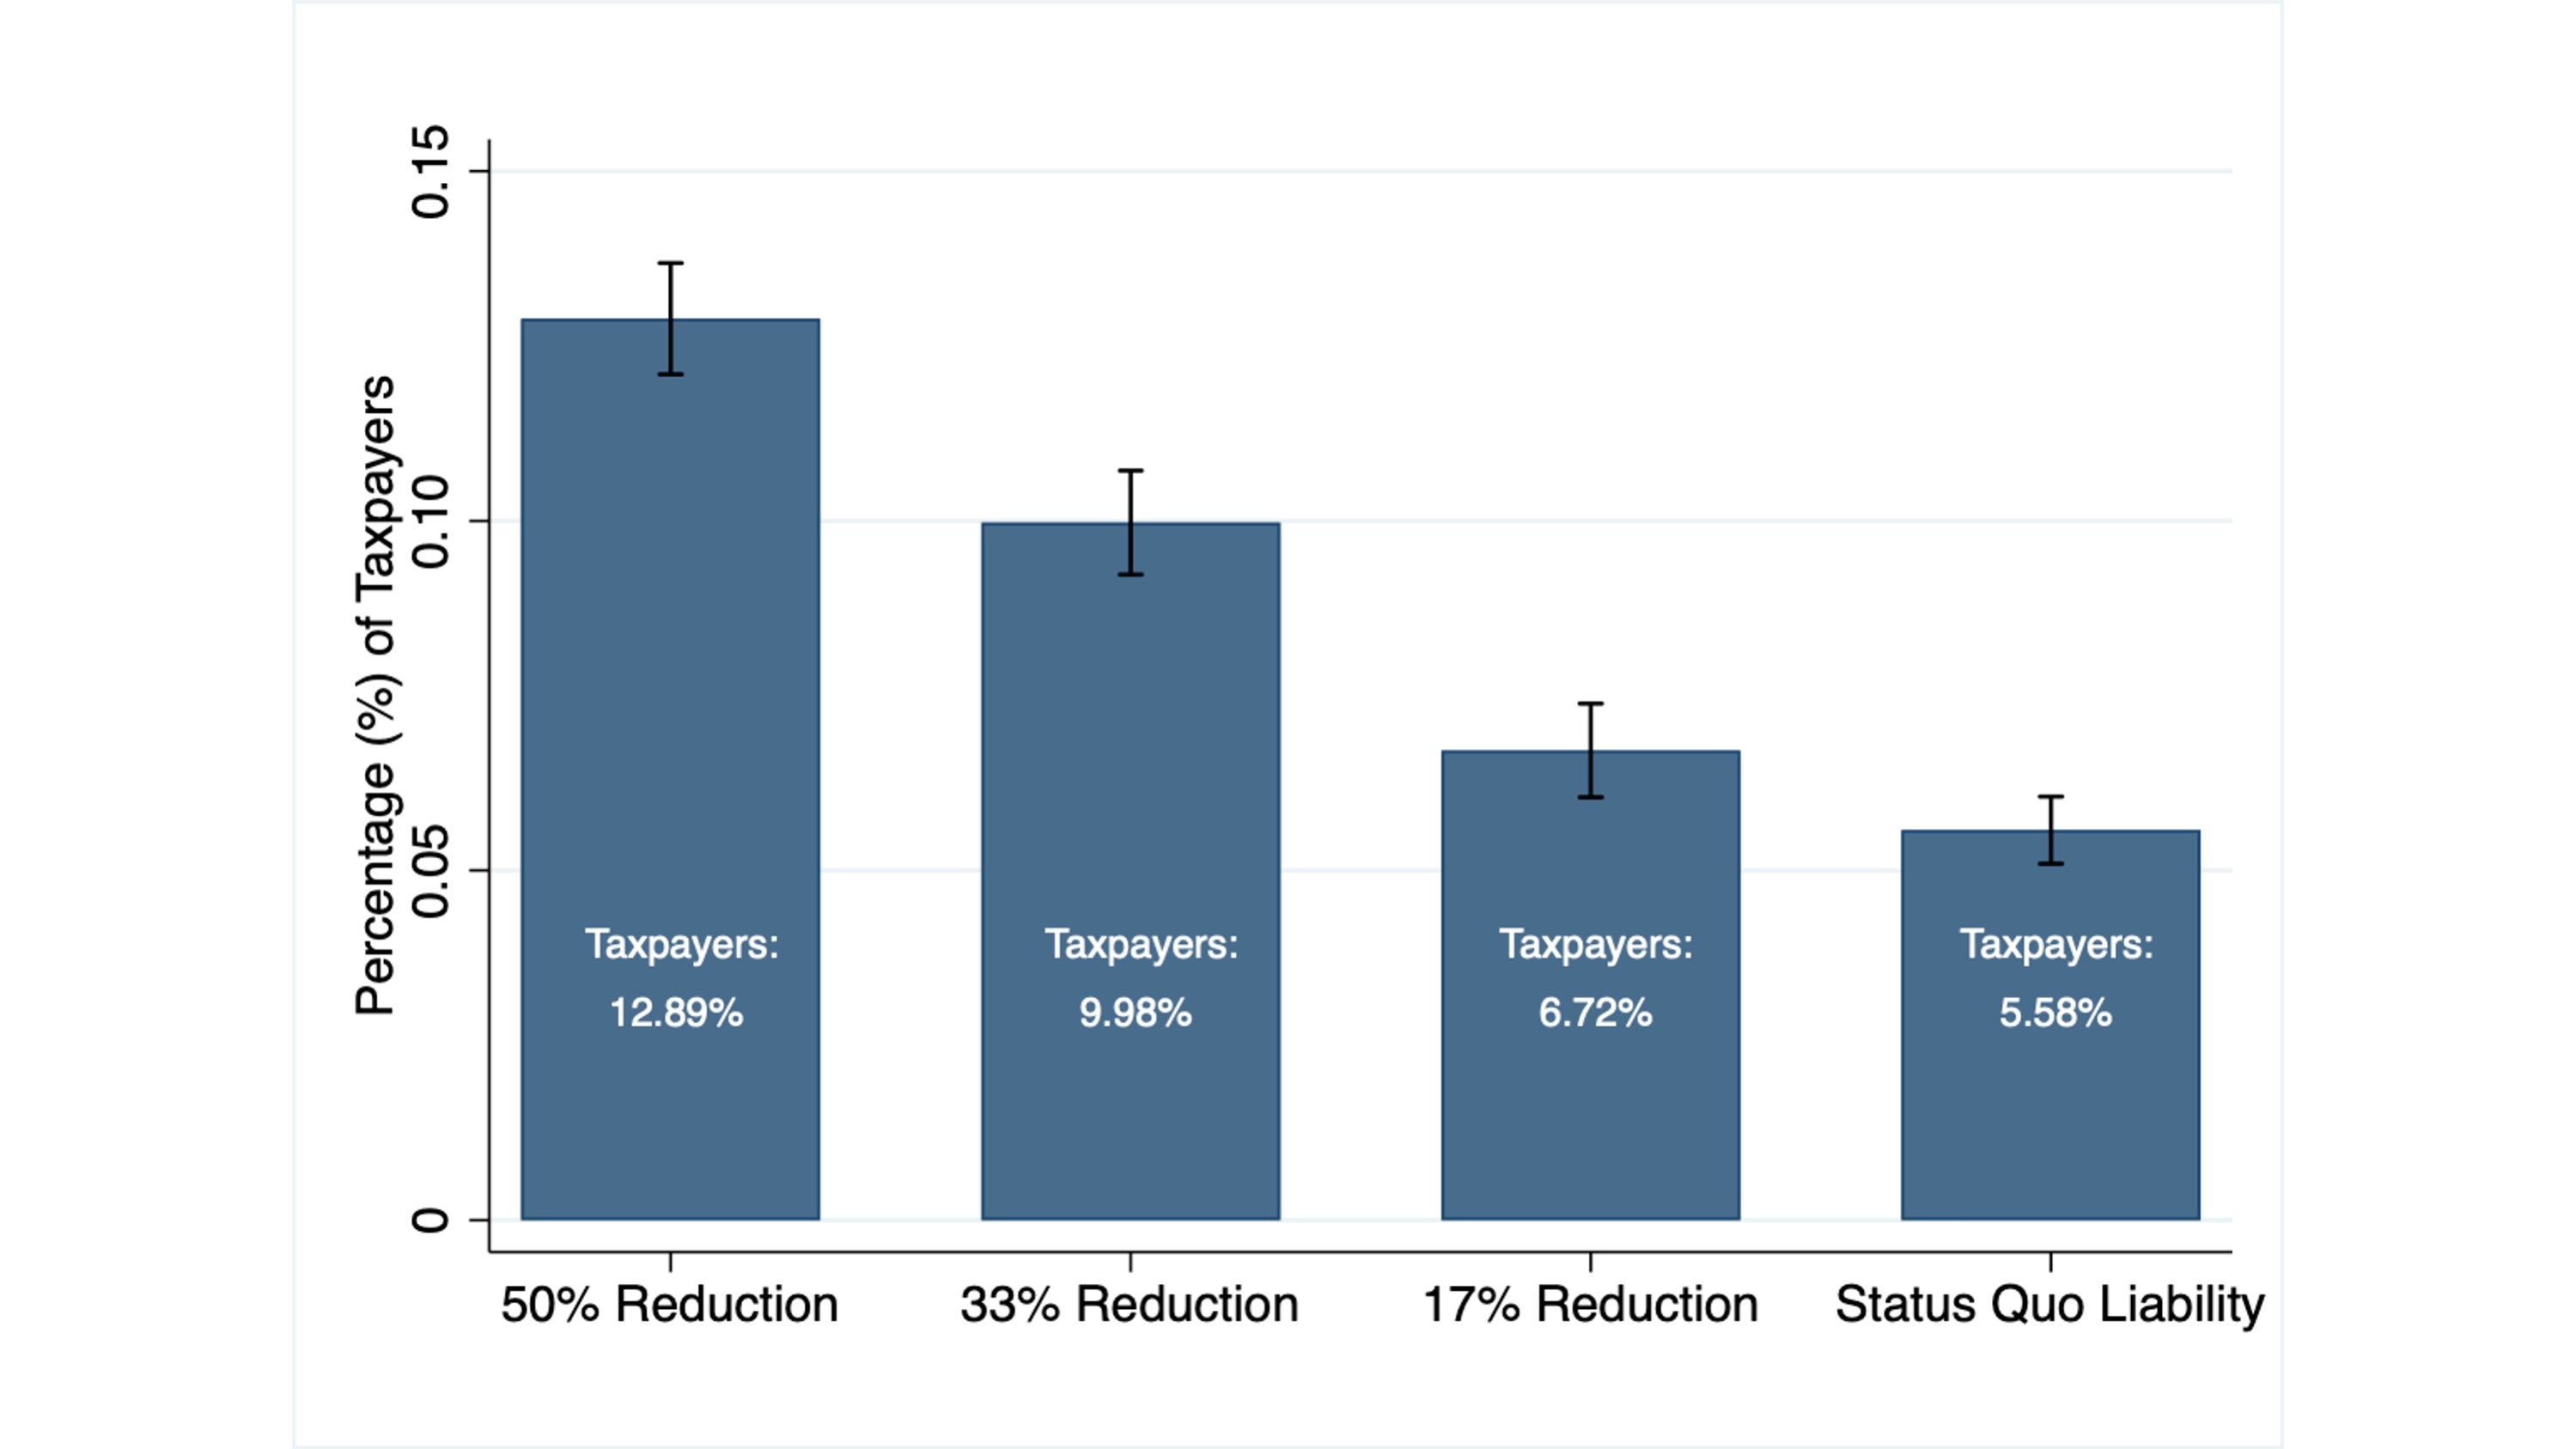
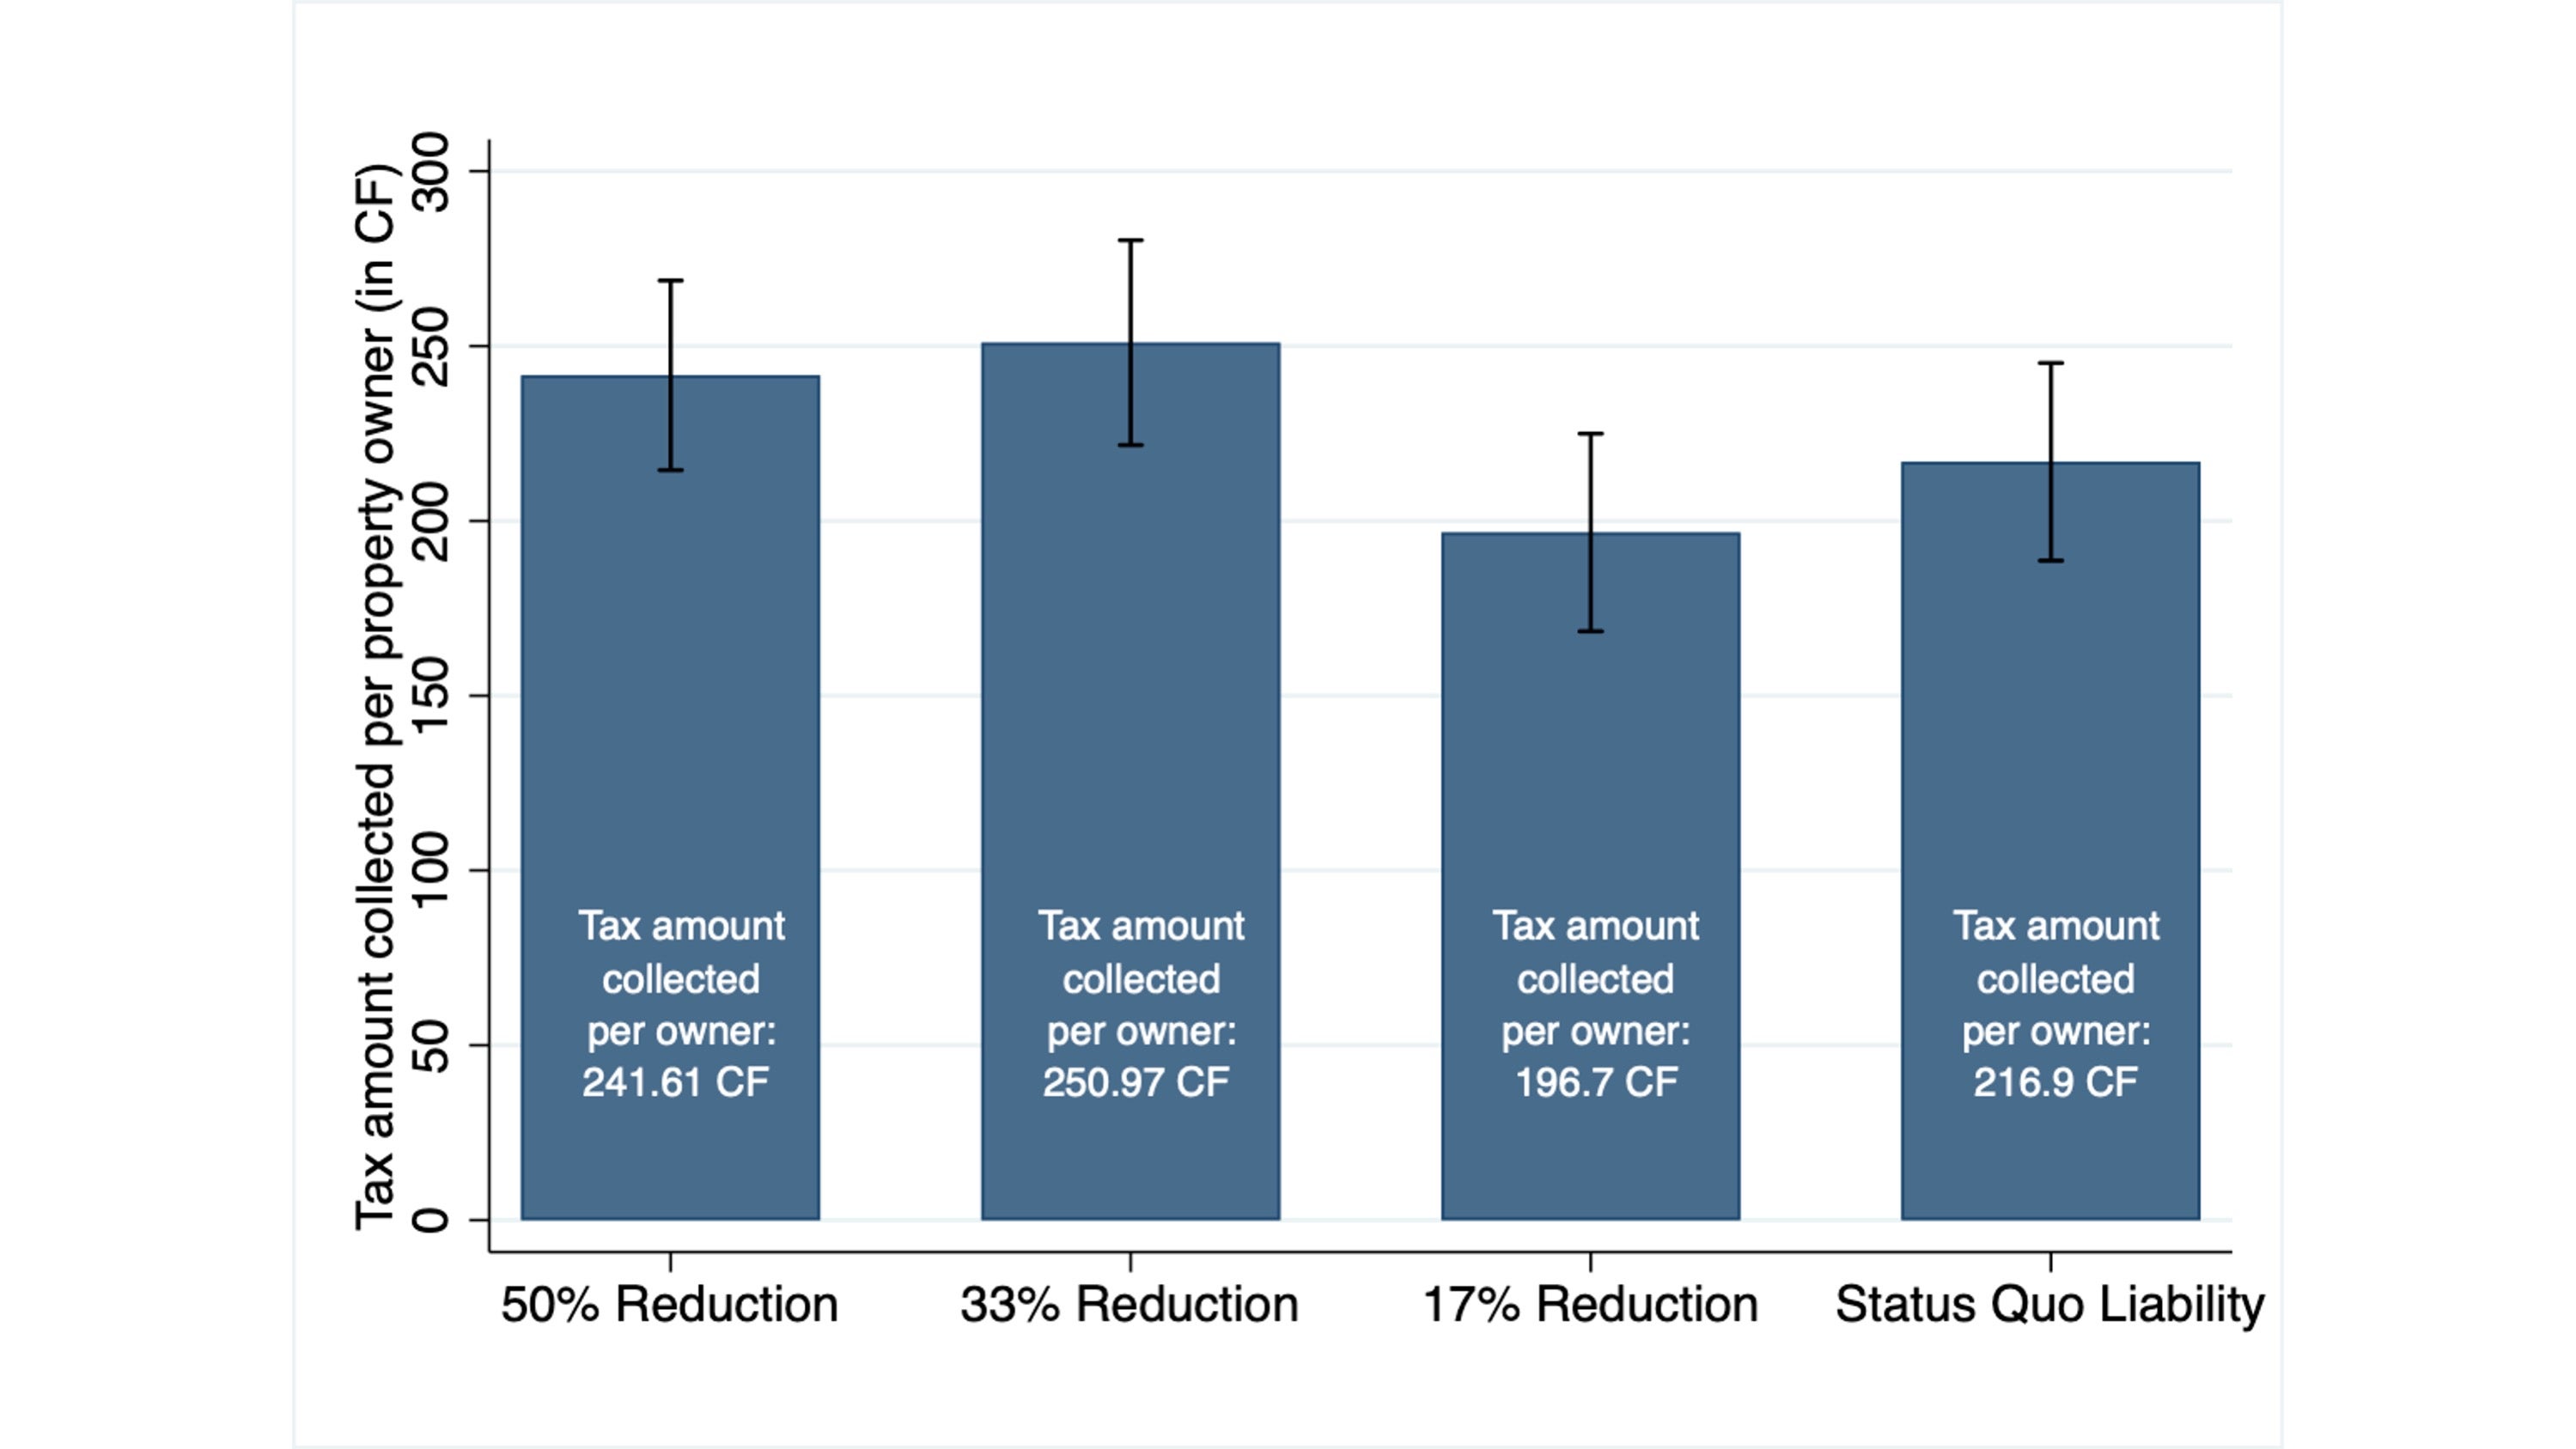
As in most low-income countries, tax compliance is low in Kananga. On average, 8.8% of property owners paid the property tax in 2018. However, lower tax rates substantially increased compliance. Only 5.6% of the owners assigned to the status quo tax liability paid the property tax, compared to 6.7%, 10%, and 12.9% for owners assigned reductions of 17%, 33%, and 50%, respectively (Figure 1, Panel A). The increase in extensive margin tax compliance translated into revenue gains at lower tax rates. Tax revenues per property owner were significantly higher (at the 5% level) for individuals assigned to the 50% and 33% reduction treatment groups than for those assigned to the 17% reduction or the status-quo tax rate (Figure 1, Panel B). In sum, tax rates are above the revenue-maximizing tax rate in this setting, and the government could increase revenue by lowering tax rates.
To estimate the precise reduction that would maximize revenue, we develop a simple theoretical framework focused on how tax rates affect citizens’ decision to pay the property tax. This framework allows us to derive a formula for the revenue-maximizing tax rate that we can bring to the data. This approach gives results that are very similar to the treatment effects: the government would maximize its tax revenue by reducing the status quo tax rate by approximately 34%.
In the paper, we examine a number of alternative explanations for the compliance responses to tax rate reductions, including whether property owners were motivated by fairness considerations or the sense of getting a “good deal”—and whether collectors exhibited enforcement effort differentially across rates. In estimating heterogeneous effects by property owners’ awareness of others’ tax rates, or of the existence of tax abatements in Kananga, we find little evidence of these explanations. The randomized rate reductions do have a larger effect on property owners facing significant cash-on-hand constraints (according to self-reported survey measures), which suggests the importance of liquidity constraints as a mechanism, resonating with recent evidence from Mexico (Brockmeyer et al., 2020) and the United States (Wong, 2020).
Figure 1: Treatment Effects on Tax Compliance and Tax Revenue
Panel A: Tax Compliance
Panel B: Tax Revenue
Note : This figure summarizes estimates from a regression of tax compliance or tax revenue on dummies for the tax abatement treatment groups. The control group, assigned to the status quo property tax rate, is the excluded category. Panel A uses an indicator for tax compliance as the dependent variable while Panel B uses tax revenue (in Congolese Francs). All estimations include property value band and randomization stratum fixed effects. The black lines show the 95% confidence interval for each of the estimates using robust standard errors. The data include all non-exempt properties registered by tax collectors merged with the government’s property tax database. The treatment effects on compliance are significantly different (at the 1% level) from control in the 50% and 33% reduction treatments, and at the 5% level in the 17% reduction treatment. The treatment effects on revenue are significant at the 5% level for the 50% and 33% reductions, while the 17% reduction treatment group is statistically indistinguishable from control.
Enforcement and Tax Rates as Complementary Policy Levers
In our setting, the government could raise revenues by lowering the status quo rate. Yet could the government invest in its enforcement capacity to raise the revenue-maximizing rate? To study this question, we use two sources of exogenous variation in enforcement capacity that raise the perceived probability of sanctions for tax delinquency while leaving the magnitude of fines unchanged.
The first comes from randomized messages embedded in government tax letters. Property owners were randomly assigned to receive an enforcement message noting the penalties for tax delinquency—an intervention shown to increase compliance in many settings (Pomeranz 2015)—or a control message noting that paying taxes is important. The second source of variation in enforcement comes from random assignment of tax collectors to neighborhoods of Kananga. Collectors naturally vary in their intrinsic enforcement ability, so some neighborhoods were randomly assigned to high-type collectors, while others were assigned to low-type collectors. We estimate each collector’s enforcement ability as the average tax compliance they achieved across all neighborhoods to which they were randomly assigned.
We find that higher enforcement capacity attenuates the delinquency response to higher tax rates, and thus increases the tax rate that would maximize revenue. In fact, the revenue-maximizing tax rate is 41% higher for owners who received an enforcement message than for those who received a control message. Similarly, replacing tax collectors in the bottom 25th percentile of enforcement capacity by average ones would raise the revenue-maximizing rate by 42%. Put simply, tax rates and enforcement are complementary levers.
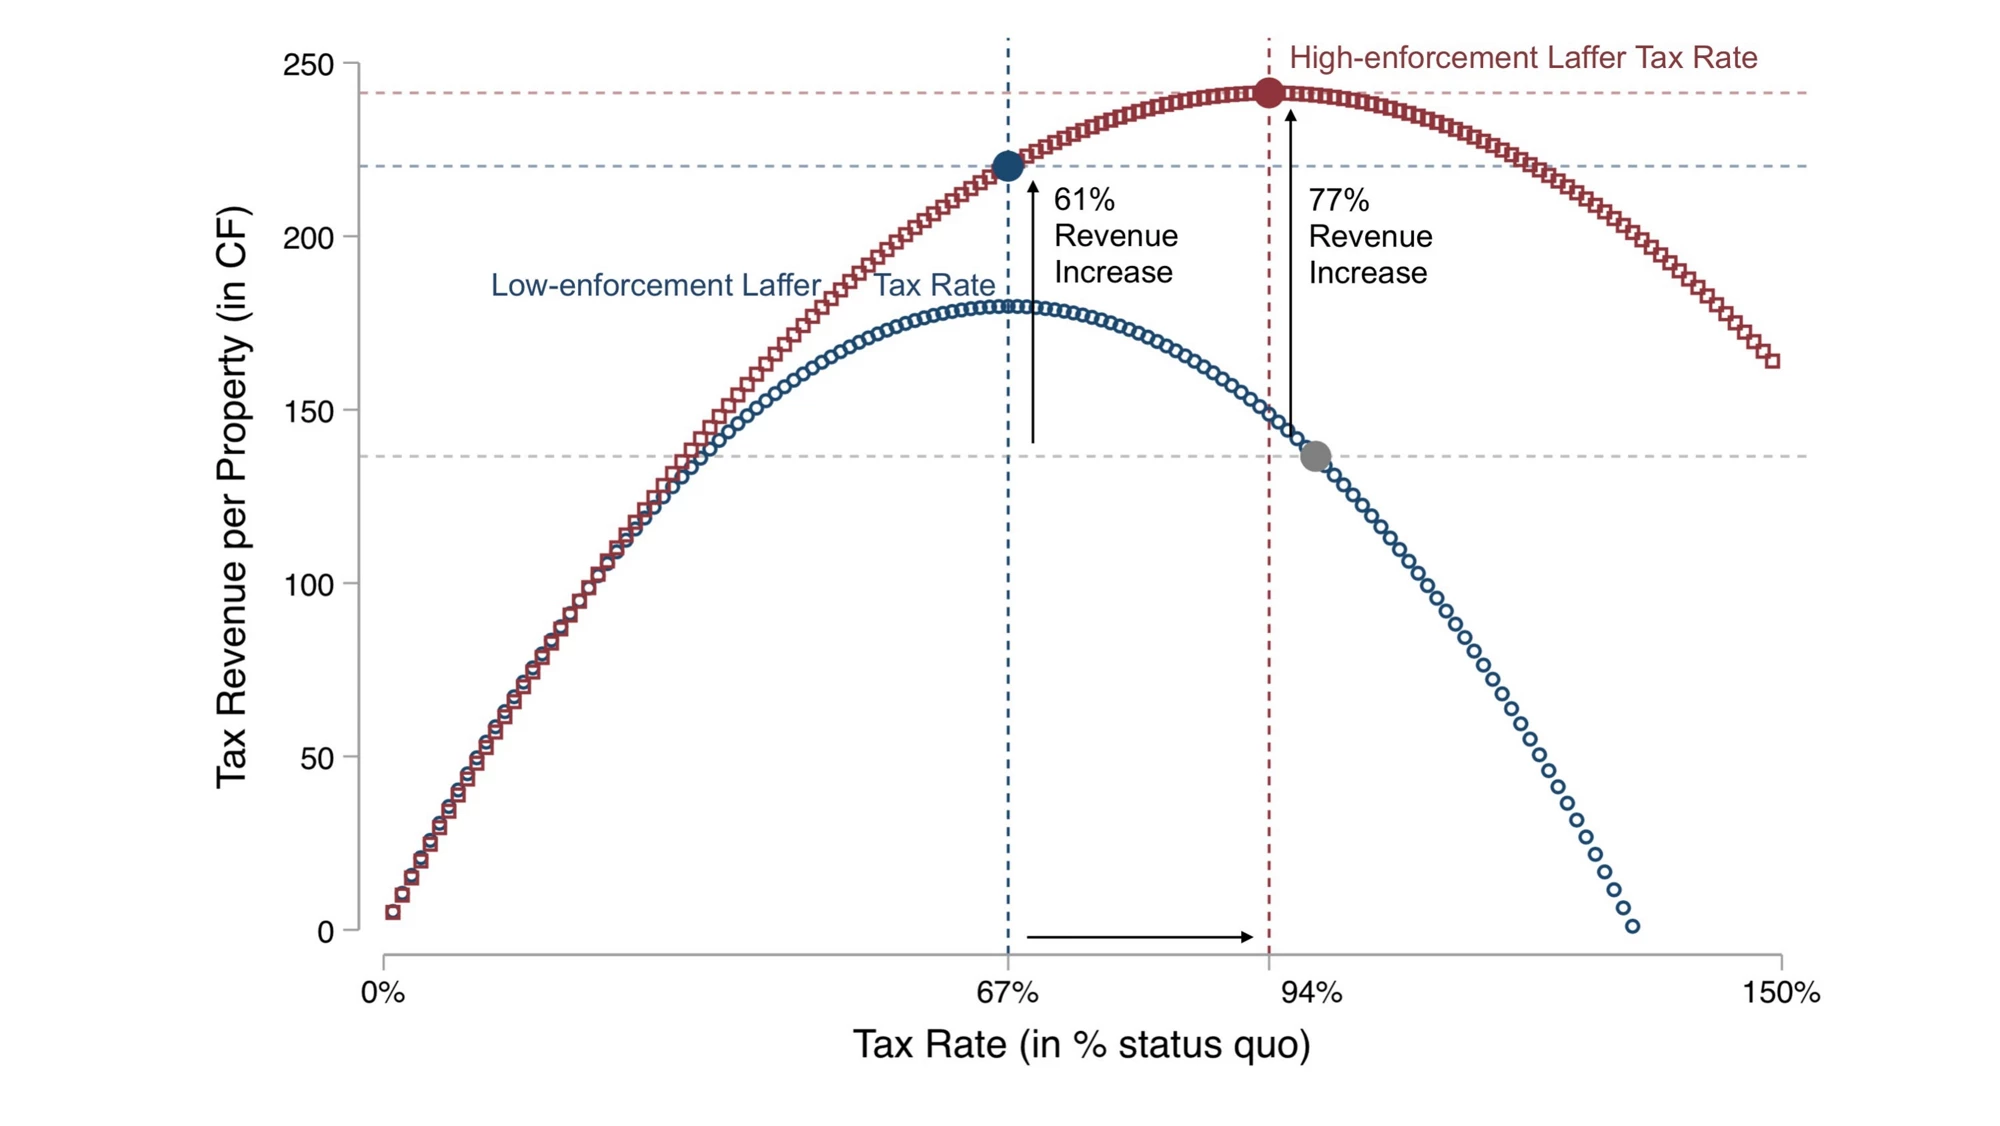
We then illustrate in Figure 2 how the government could leverage this complementarity to better counter the revenue deficits it faces. According to predictions based on our estimates, a “naïve” government that sequentially increases rates and then enforcement would increase revenue by 61%. By contrast, a “sophisticated” government that adjusts both optimally—prospectively choosing the post-enforcement Laffer rate—would increase revenue by 77%.
Figure 2: Tax Rates and Enforcement as Complements – Revenue Implications
Note: This figure reports estimates of the relationship between tax rates (x-axis) and tax revenue per property owner (y-axis). We predict tax revenues at different hypothetical tax rates using the coefficients from a regression of compliance on the tax rate. The graph compares the predicted relationship between tax rates and tax revenues in the current enforcement environment (blue dotted line) and after the government increases its enforcement capacity by replacing collectors in the bottom 25th percentile of enforcement capacity by average tax collectors (red dotted line). The vertical lines indicate different potential tax rates, while horizontal lines indicate the corresponding revenue levels. In our example, a naive government would sequentially increase rates and increase enforcement, increasing total revenue by 61%, while a sophisticated government would prospectively choose the post-enforcement Laffer rate and increase revenue by 77%.
Policy Implications
Our results suggest that when tax enforcement is weak, lowering tax rates can increase tax revenue due to higher tax delinquency at higher rates. However, this delinquency response to high tax rates attenuates as governments invest in their enforcement capacity. Ultimately, developing country governments may be able to generate more tax revenue if they increase tax rates in tandem with tax enforcement.
Augustin Bergeron is a PhD student at Harvard University


Join the Conversation