When asked if he would like to have dinner at a highly-regarded restaurant, Yogi Berra famously replied “Nobody goes there anymore. It’s too crowded”. This contradictory situation of very low take-up combined with large overall use is common with some financial products – for example, the response rate to direct mail credit card solicitations had fallen to 0.6 percent by 2012, yet lots of people have credit cards.
It is also a situation we recently found ourselves in when working on a financial education experiment in Mexico with the bank BBVA Bancomer. They worked with over 100,000 of their credit card clients, inviting the treatment group to attend their financial education program Adelante con tu futuro (Go ahead with your future). Over 1.2 million participants have taken this program between 2008 and 2016, yet only 0.8 percent of the clients in the treatment group attended the workshop. A second experiment which tested personalized financial coaching also had low take-up, with 6.8 percent of the treatment group actually receiving coaching.
In a new working paper (joint with Gabriel Lara Ibarra), we discuss how the richness of financial data on clients allows us to combine experimental and non-experimental methods to still estimate the impact of this program for those clients who do take up the program.
What would pure experimental analysis tell us?
73,654 clients were assigned to the treatment group for the workshop. Out of this, contact was attempted with only 47 percent, and only 12% (8,900) were able to be contacted, of which 2,672 agreed to participate, and only 583 attended and completed the workshop (0.8%).
With such a low take-up, not surprisingly the treatment and control groups averages follow one another closely after the intervention, just as they had done before the intervention (Figure 1). The ITT estimates are then extremely close to zero. The LATE estimates are statistically insignificant, but with wide confidence intervals. For example, the LATE impact for the outcome of having a delay in payment is [-20%, +30%].
Figure 1: Treatment vs Control Time Paths 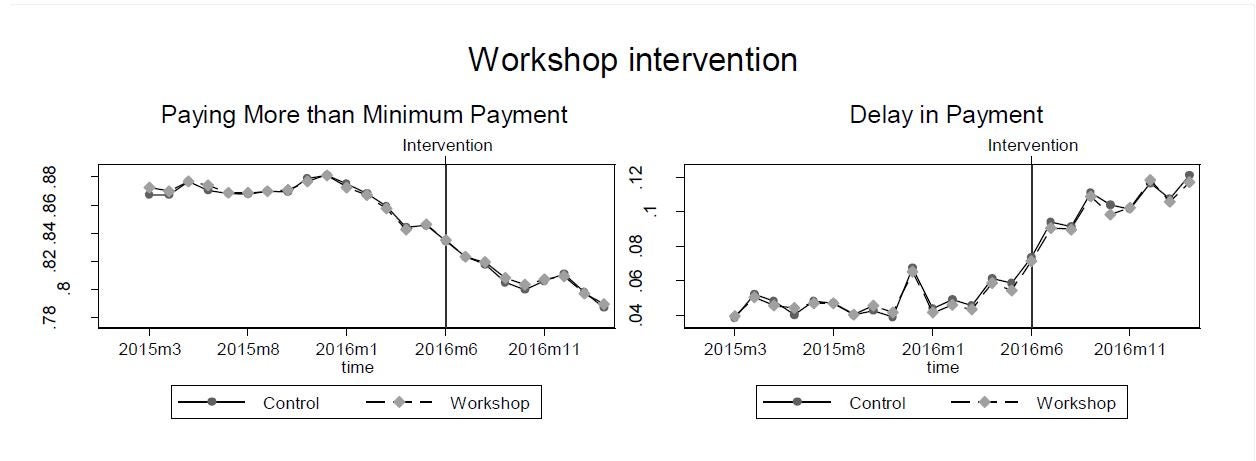
We are of course being killed here by low take-up – the inverse square rule means that we need 15,625 times the sample with 0.8% take-up as we would to have the same power as 100% take-up. Even with our large sample sizes, power is then very low.
This is where standard analysis using experimental methods would stop. We would conclude that there is no significant impact of either intervention, but that we have insufficient power to rule out a wide range of positive and negative impacts. We therefore turn to combining non-experimental methods with the experiment to obtain more informative results.
Combining non-experimental and experimental methods with lots of data
We have a large sample of over 130,000 clients, and have monthly data on their credit card outcomes for up to 18 months before the intervention. We use this large dataset (of 660 MB) to combine propensity score matching and difference-in-differences with the experiment in order to estimate the treatment effect for those who actually take-up training. In doing so, we can overcome some of the common concerns one usually has with these non-experimental approaches:
- With matching we are usually concerned with at least two types of selection on unobservables. The first is dynamic selection – for example, people might be more willing to engage in financial education if they suddenly find themselves struggling with their credit card, compared to individuals who look similar in the cross-section but who have been struggling for a while. We can match on the entire trajectory of payment behavior over 18 months to alleviate this concern. Secondly, the concern is if these groups are so similar, why did only one group take the intervention? By matching only to individuals in the control group, we have an answer – they randomly weren’t invited.
- With difference-in-differences we are concerned about the assumption of common trends. This is more credible if the two groups are more similar to begin with (which is where matching helps), and if we see they have the same dynamics pre-intervention. With survey data, researchers are typically lucky if they have two periods of post-intervention data to test for a common linear trend over that short period. Here we can use all 18 months of pre-intervention data to show they follow the same non-linear trends pre-intervention.
We explore five different approaches to obtaining a non-experimental counterfactual, varying which variables we match on and whether we restrict ourselves to all matches in the common support or to just using the nearest neighbor matches. This allows us to show robustness of our results to the choice of counterfactual.
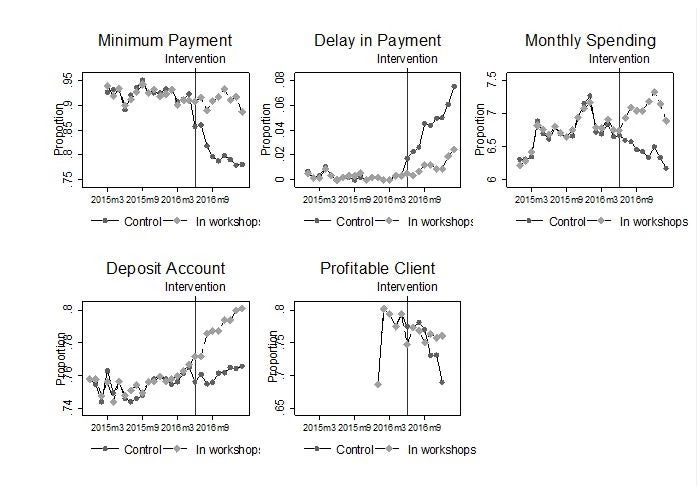
Figure 2 then shows the results for the workshops (the coaching intervention had similar effects). The results of our preferred specification suggest that participating in the workshop results in an 11 percentage point increase in the likelihood of paying more than the minimum payment, a 3.4 percentage point reduction in the likelihood of delaying payment, 63.7 percent higher monthly spending on the credit card, and a 2.7 percentage point increase in the likelihood of owning a deposit account with our partner bank.
Figure 2: Trajectories of financial outcomes of those receiving workshops compared to nearest neighbor matched control group
The training and coaching get clients to pay their accounts on time and pay more of their bills, but do not get them to cut back on spending. In fact, perhaps because they are not experiencing as many payment problems, they spend more on their cards. The result is that this training does increase the likelihood these clients remain profitable for the bank.
A by no means unique situation
While we always would prefer to have much higher take-up for our interventions and to just rely on pure experimental comparison of treatment versus control groups, there are many “low touch” interventions carried out by companies that have really low response rates, but can reach large numbers of clients – e.g. the click rate for email marketing campaigns by the banking/finance industry in the U.K. was 0.39%. This combination of rich data on customers with the initial experiment may provide a way to salvage a credible measure of the treatment impact in these situations. So even if you made too many wrong mistakes, remember your evaluation ain’t over till it’s over, and with today’s big data, you can observe a lot by just watching.


Join the Conversation