Popular data
Nighttime lights satellite imagery (DMSP-NTL) are now a popular data source among economists. In a sentence, these imagery encompass almost all inhabited areas of the globe, and record the average quantity of light observed at each pixel (nominal size ~1km2) across cloud-free nights for every year, 1992-2012. In under-developed or conflicted regions, where survey or census data at a fine level of spatial and temporal disaggregation are seldom available or reliable or comparable over space or time, NTL and other satellite imagery can be an excellent resource. Recent economics papers have used NTL to study growth of cities in sub-Saharan Africa (Storeygard (2015)), production activity in blockaded Palestinian towns of the West Bank (Abrahams (2015), van der Weide et al (2015)), and urban form in China (Baum-Snow & Turner (2015)) and India (Harari (2015)).
Blurring and other errors
NTL imagery suffer from several sources of measurement error, including top censoring in very bright areas (but non-top-censored imagery are now available for many years) and lack of comparability across years and satellites (but Wu et al (2012) and Hsu et al (2015) provide adjustment parameters). Perhaps most notoriously, the imagery are blurred. Cities appear magnified to approximately 10 times their true size (Imhoff et al (1997), Henderson et al (2003), Small et al (2005)). The mislocation of light (economic activity) can be quite large – for a selected sample of cities, we estimate 72% of light emitted by cities falls outside urban boundaries. In studies where areas of interest lie close together, cross-spillage of light corrupts estimates and comparisons of economic activity (for example, comparing areas lying on opposite sides of national borders, as in Pinkovskiy (2011), or comparing adjacent neighborhoods of a city, as in Agnew et al (2008)). Indeed, our study of blurring was motivated by cross-spillage of light in the West Bank, where impoverished Palestinian villages seemed very bright (economically active) at night, partly due to spillage from nearby Israeli settlements.
Figure 1
Why blurring happens
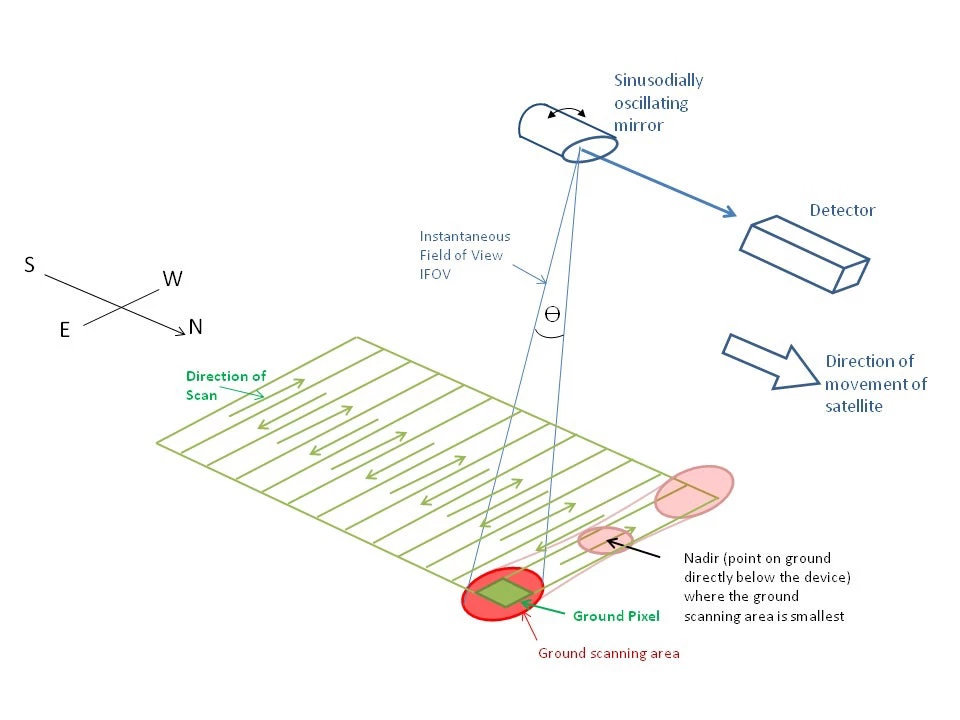
We argue in Abrahams, Lozano-Gracia, Oram (2015) that blurring occurs because of DMSP satellites' on-board optics. As depicted in Figure 1 above, each satellite's effective instantaneous field of view (EIFOV, or in other words the area on the Earth's surface viewed by the satellite at any given instant) is large and circular when the satellite is looking directly beneath itself, and even larger and elliptical when the satellite is viewing locations at an angle. Since the annual imagery are composited from nightly images taken at multiple viewing angles, a point light source is ultimately recorded as an integral of ellipses of light. Knowing the altitude of the satellite, the radius of the circular EIFOV at nadir, and assuming that viewing angles across all cloud-free nights of the year are uniformly distributed, we can simulate what the blur should look like for an isolated point light source. Figure 2 below depicts the point-spread function (PSF) for a pixel emitting 100 units of light, where pixels are 916m x 921m, matching the UTM projection of the region surrounding Addis Ababa, Ethiopia.
Figure 2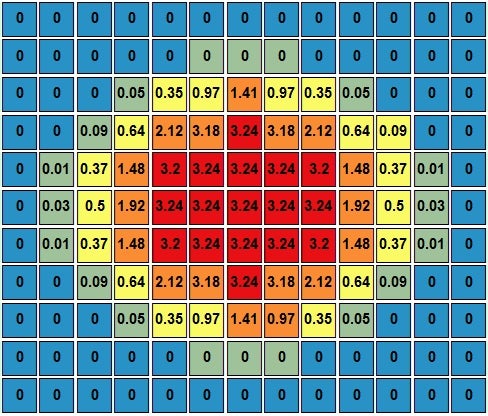
De-blurring
In the absence of noise, we can model the observed NTL image as a vector y of light intensity values, equal to the true image vector x left-multiplied by a distortion matrix: Ax=y. The distortion matrix A applies the PSF to each light-emitting pixel, spilling light onto neighboring pixels at different rates that vary across elliptical bands (donuts) around the pixel. The true image is then x = A-1y.
Handling noise
In the presence of noise, A-1y recovers a somewhat erroneous image. To improve it, we exploit the fact that every NTL image has a corresponding 'frequency' image, where each pixel records the percentage of cloud-free nights on which the pixel was lit. We use the frequency image to clean up our de-blurred images. In particular, we set to zero all pixels lit less than 20% of cloud-free nights, dismissing these light sources as wildfires, passing cars, scattered moonlight, etc. And since it follows from the trigonometry of data collection that light sources must all be local maxima in the frequency surface, we set to zero all pixels that are not.
Figure 3
Before-and-after comparison
Figure 3 depicts a before-and-after comparison of Addis Ababa in 2010 (F18 satellite). The kmz file of this image, which can be opened in Google Earth, matches Google's urban footprint for Addis remarkably well. The primary artery leading southeast out of Addis to the suburb of Bishoftu, while indiscernible in the blurred image, comes through clearly after de-blurring. Within central Addis, the blurred image depicts only a blob of brightly lit pixels, suggesting a monocentric city structure, whereas the de-blurred image shows multiple centers of activity.
How our code works
We implement de-blurring by writing a series of Python and Matlab scripts. The user need only specify a rectangular region to be de-blurred, and a projection system appropriate for calculating distances in the geographic region of interest. The code divides the user-defined rectangle into smaller rectangles, forms the A matrix for each sub-image, and obtains A-1y. The large de-blurred image is then reconstructed from the de-blurred sub-images. Ellipses may be censored when point light sources lie near the edge of sub-images. To account for this, we allow substantial overlap between adjacent sub-images, then extract only the 'core', center area of each sub-image when reconstructing the large image. Since the sub-images are de-blurred independently of each other, we take advantage of parallel processing to reduce computation time.
Next steps
By mid-June we would like to make the code freely downloadable from this website, with a read-me file to get users started. We intend to update the code to test if our imposed PSF matches the data consistently worldwide. It is our hope that researchers will run our code and use the de-blurred NTL imagery to pursue questions at finer levels of spatial disaggregation.
About the authors
Alexei Abrahams graduated on Sunday with a PhD in Economics from Brown University. He has joined the Empirical Studies of Conflict (ESOC) research group and has accepted a post-doctoral fellowship at UC San Diego's Institute for Global Conflict and Cooperation (IGCC).
Co-authors: Nancy Lozano-Gracia, Christoper Oram


Join the Conversation